Executive Summary: Evaluating marketing success using surface-level activity metrics (impressions, clicks, raw traffic) creates false signals that fail to defend ad budgets. As customer acquisition costs rise and ecommerce ROAS tightens, executive teams require a concise scorecard built on financial metrics: Customer Acquisition Cost (CAC), Lifetime Value (LTV), LTV:CAC Ratio, CAC Payback Period, and Marketing-Influenced Revenue.
Key Takeaways
- The Measurement Crisis: While 85% of marketers claim they can measure ROI, only 8% have a reliable method to prove their actual financial impact [¹].
- Data Integration Blockers: 48% of marketers identify data silos as their primary barrier to accurate ROI measurement [¹].
- The Cost of Vanity Metrics: Failing to align marketing KPIs with true business outcomes leads to up to 30% inefficiency in ad spend [²].
- Macro Benchmarks: Average ecommerce ROAS sits around 2.87x [⁵], while ecommerce CAC ranges from $68 to $84 across major verticals [⁴].
- The Golden Ratio: A healthy LTV:CAC ratio benchmark is 3:1 or higher; anything below 3:1 indicates unsustainable customer acquisition costs [³].
Why Most Marketing Reports Prove Nothing
Most marketing reports are designed to demonstrate activity rather than business impact. They highlight top-of-funnel volume—impressions, video views, and page visits—because these numbers continuously increase and are easy to pull from platform dashboards. However, they rarely answer the core financial question: Did this spend generate net profit?
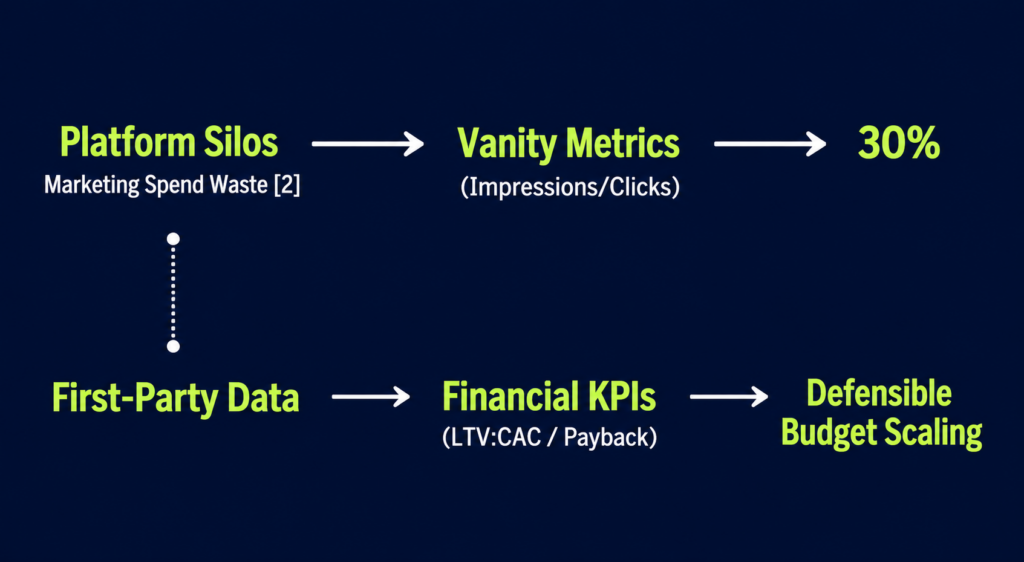
The gap between reporting activity and proving financial return is well-documented:
- The Attribution Gap: Only 36% of marketers express confidence in their ROI calculations [¹].
- The CMO Attribution Deficit: Only 3% of CMOs can attribute more than half of their marketing spend directly to revenue, while 34.2% of organizations rarely or never measure marketing ROI at all [²].
- Data Disconnection: Ad platform self-reporting creates conflicting numbers. Without a centralized first-party data and attribution strategy, marketing teams fall back on vanity numbers that finance departments reject.
Vanity Metrics: Numbers That Look Good vs. ROI Metrics That Matter
A vanity metric is any data point that appears positive on a dashboard but cannot be linked to cash flow, contribution margin, or customer retention. Optimizing campaigns around vanity metrics causes teams to pay for applause rather than business growth.
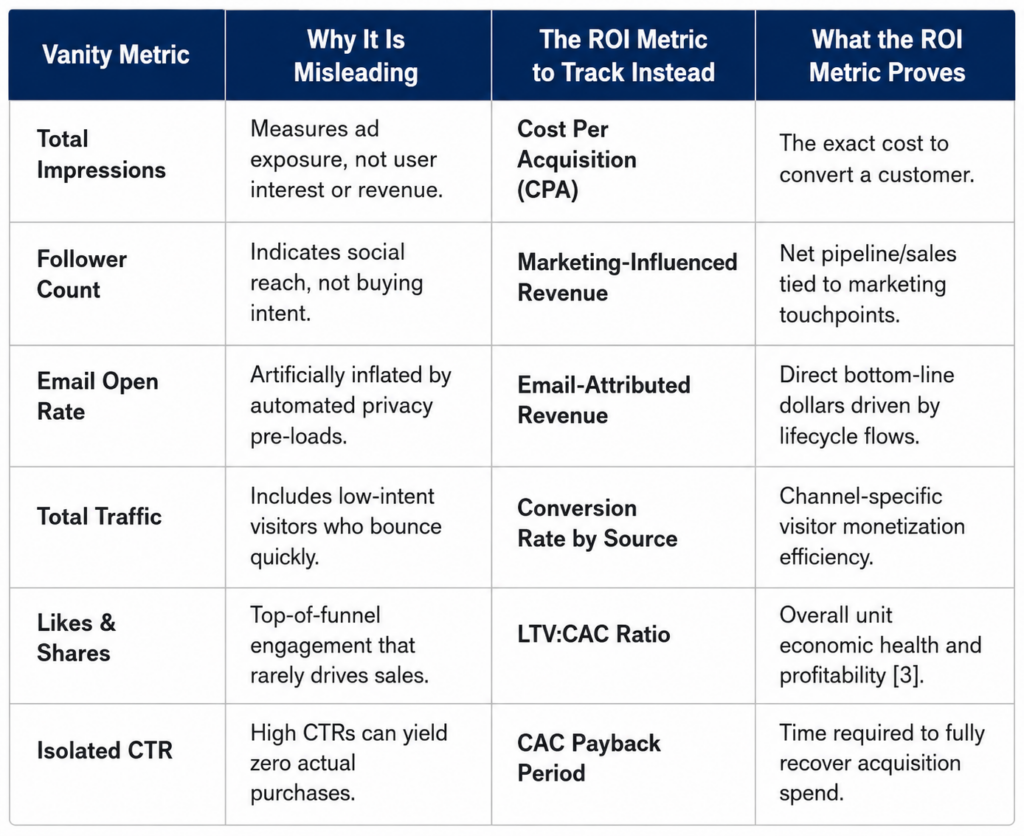
The 6 Most Common Vanity Metrics to Demote:
- Raw Impressions & Reach: Measures ad rendering, not user intent or sales conversion.
- Follower Counts: Measures passive social reach, not active purchasing intent.
- Email Open Rates: Highly distorted since Apple Mail Privacy Protection (MPP) pre-loads tracking pixels, artificially inflating open counts.
- Unqualified Web Traffic: High bounce-rate sessions that do not generate leads or orders.
- Likes & Social Shares: Engagement signals that rarely correlate with bottom-line sales.
- Isolated Click-Through Rate (CTR): Indicates creative curiosity, but fails to measure downstream order values or customer profit.
Vanity Metrics vs. ROI Metrics: A Side-by-Side Comparison
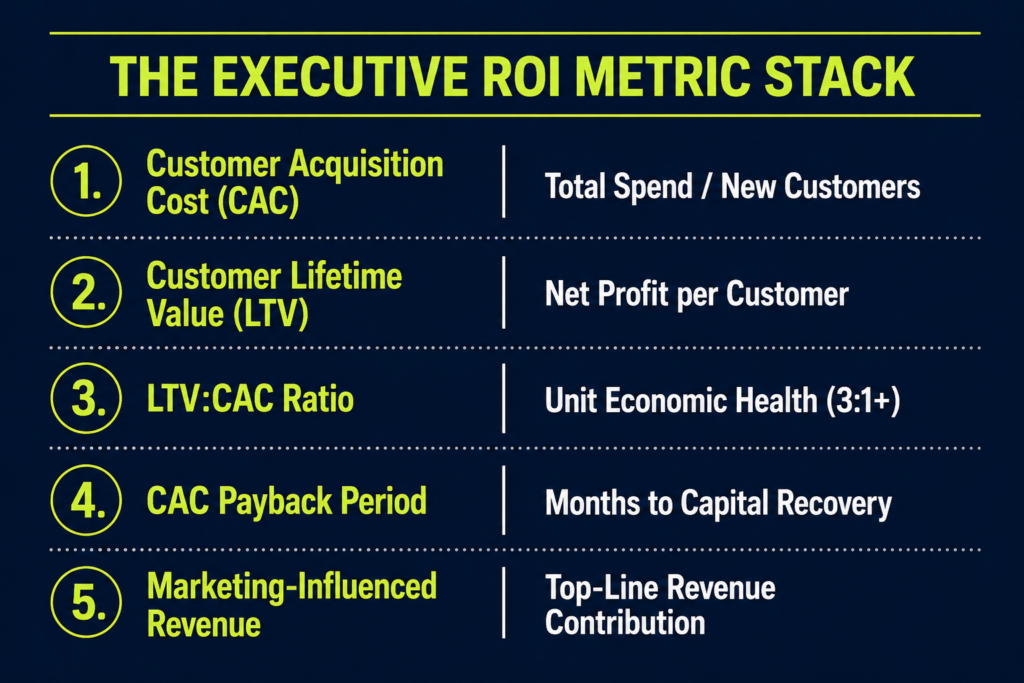
The 5 Marketing KPIs That Actually Prove ROI
To build a defensible measurement system, restrict primary executive reporting to five financial KPIs.
1. Customer Acquisition Cost (CAC)
The total sales and marketing outlay required to win a single new customer:
Average ecommerce CAC currently ranges between $68 and $84 across categories [⁴]. CAC must be tracked alongside LTV to evaluate overall efficiency.
2. Customer Lifetime Value (LTV)
The net contribution margin generated by a customer across their entire relationship:
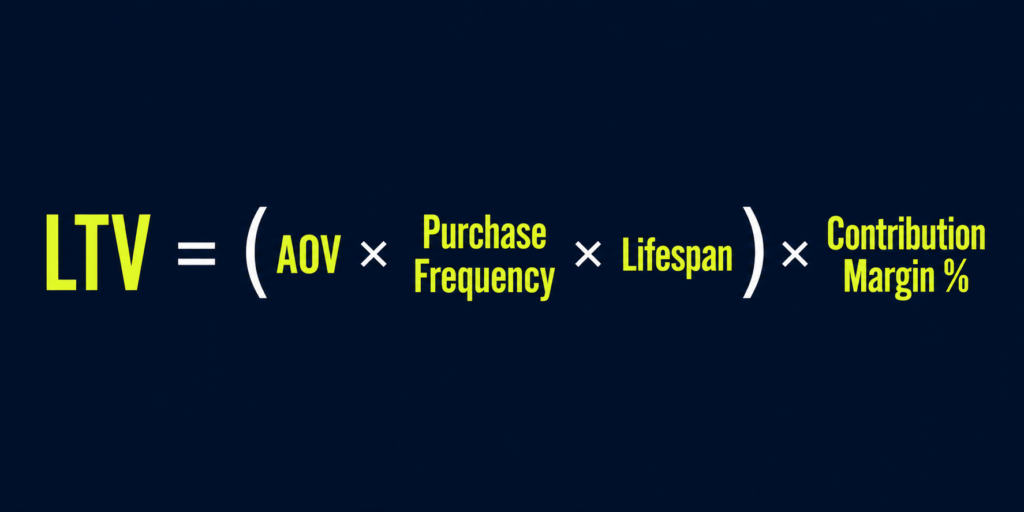
Note: Calculating LTV using gross revenue rather than contribution margin overstates customer value.
3. Return on Ad Spend (ROAS)
The direct top-line revenue generated per dollar of media spend:
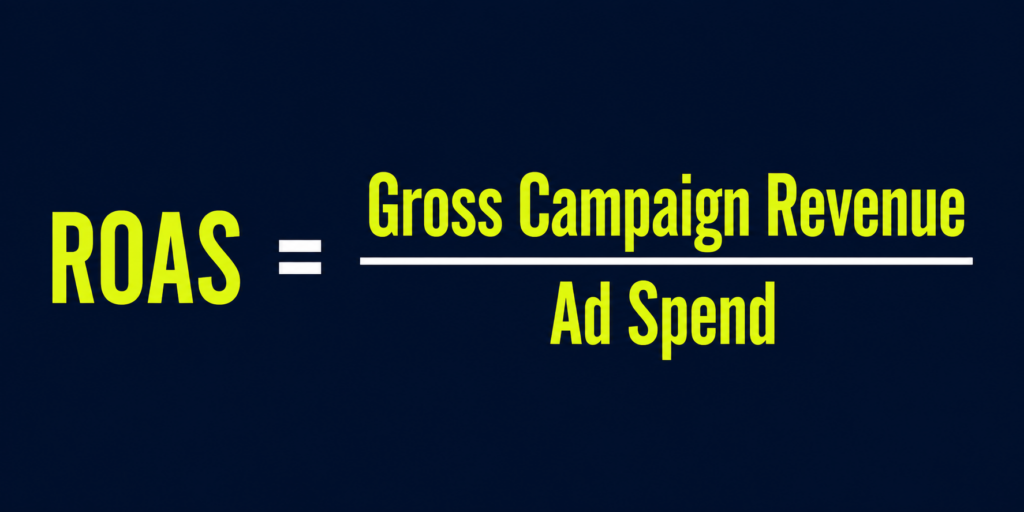
While global ecommerce ROAS averages 2.87x [⁵], ROAS should be treated as an in-channel tactical metric rather than a standalone executive KPI, as it ignores margin structure and repeat purchases.
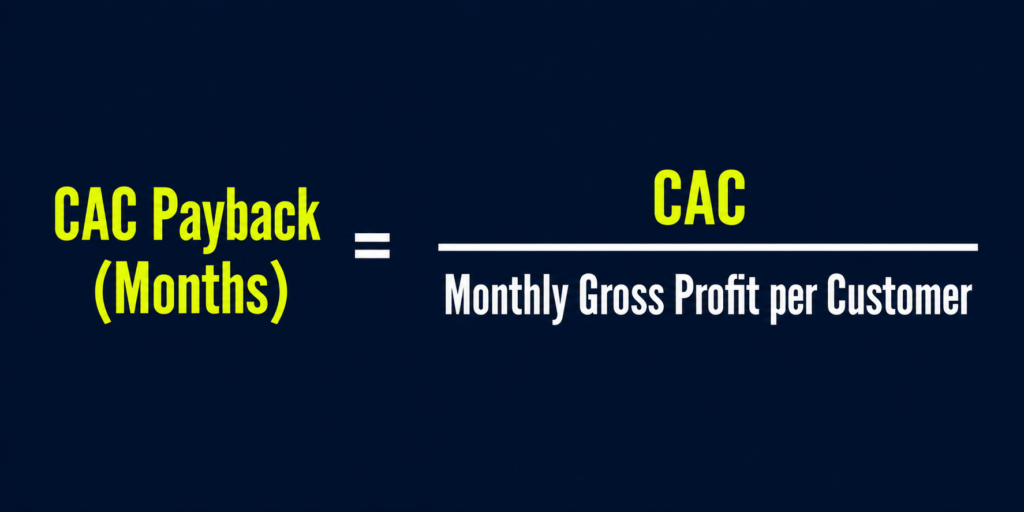
4. CAC Payback Period
The time (in months) required for a customer to generate sufficient gross profit to repay their acquisition cost:
Shorter payback periods (under 12 months) preserve cash flow and allow businesses to reinvest capital faster.
5. Marketing-Influenced Revenue
The percentage of closed revenue or pipeline that interacted with at least one marketing touchpoint. This metric directly connects marketing execution to top-line business growth.
CAC and LTV: The Ratio That Tells the Truth
Neither CAC nor LTV provides full strategic context in isolation. Evaluating them together as the LTV:CAC Ratio reveals whether a growth strategy is sustainable.
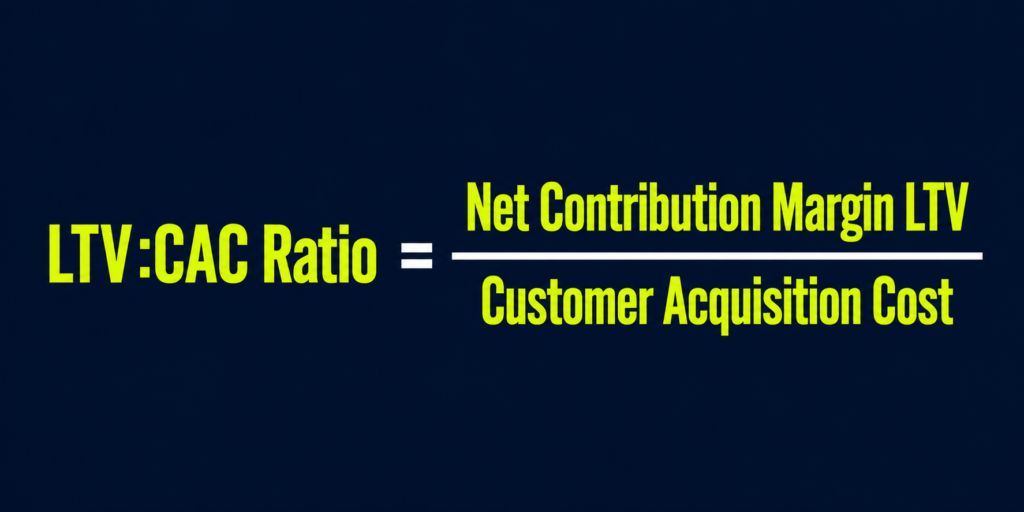
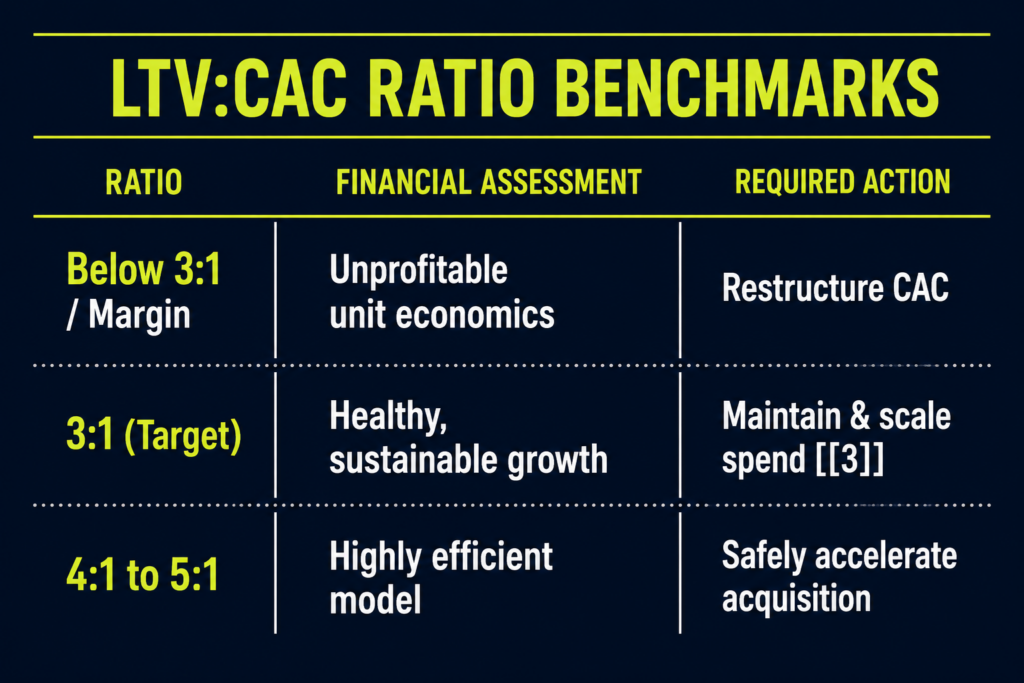
Under 3:1: The business is overspending on acquisition relative to customer retention [³].
- 3:1 Benchmark: The standard target for sustainable profit across SaaS and DTC verticals [³].
- Above 5:1: The business may be underinvesting in marketing, leaving market share open to competitors willing to bid more aggressively.
To see how macro-level ratios integrate with top-down media planning, read our guide on marketing measurement frameworks.
How to Build a KPI Scorecard That Earns Trust in 5 Steps
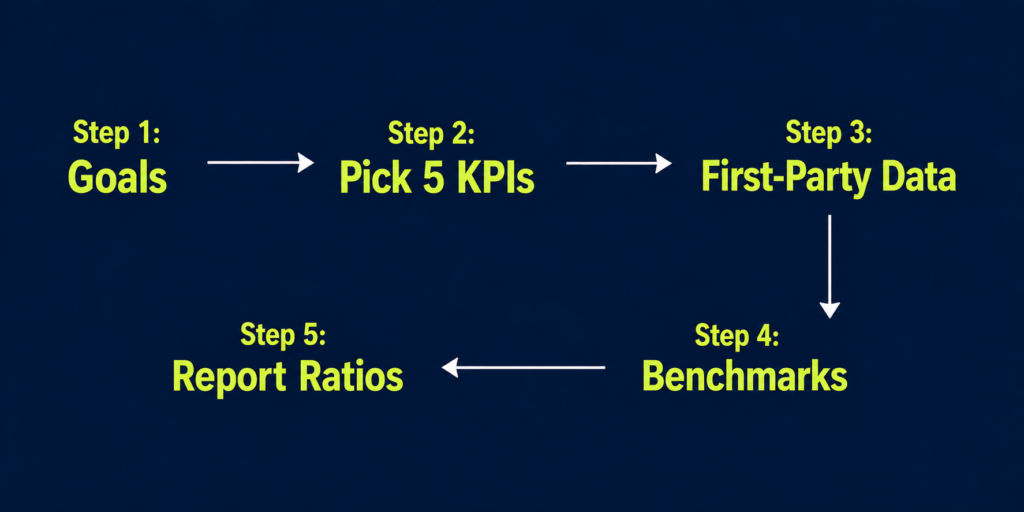
Align Metrics to Executive Goals: Define the primary operational priority for the quarter (e.g., rapid customer expansion, margin improvement, or cash preservation) and select KPIs that measure progress toward that goal.
- Limit Core Headlines to 5 Financial KPIs: Restrict board-level reporting to CAC, LTV, LTV:CAC, Payback Period, and Marketing-Influenced Revenue. Move engagement metrics to diagnostic sub-reports.
- Anchor Metrics to First-Party Data: Combine ad network spend with backend CRM/ERP sales data. Avoid relying solely on platform-reported conversions.
- Establish Benchmarks and Targets: Contextualize performance by comparing current numbers against historical averages and industry benchmarks (e.g., “CAC is $72 against an $80 target”).
- Lead with Financial Ratios: Focus executive discussions on LTV:CAC and CAC Payback Period to address business profitability directly.
Turning KPIs into Capital Allocation Decisions
Transitioning to outcome-based KPIs alters daily media buying decisions:
- Channel Reallocation: Reallocate budget away from channels with low payback periods toward campaigns that acquire high-LTV customer cohorts.
- Rapid Budget Pivots: Reallocate capital dynamically rather than waiting for post-campaign evaluations.
- Infrastructure Investment: Build a measurement foundation supported by cookieless conversion tracking setups to maintain data accuracy as browser policies change.
Partner with National Positions for Advanced Measurement Architecture
Replacing vanity metrics with a verified measurement framework requires dedicated data integration and analytics engineering.
National Positions provides complete analytics solutions for growing businesses:
- 22+ Years of Growth Analytics: Optimizing performance marketing investments for over 300 e-commerce and SMB brands.
- Google Premier Partner Leadership: Recognized in the top tier of performance marketing agencies worldwide.
- The PACE Framework: Our integrated strategy (Plan, Analyze, Convert, Expand) anchors every campaign in verified revenue data.
- First-Party Attribution via AdBeacon: Our proprietary first-party attribution platform, AdBeacon, bypasses platform self-reporting to link ad spend directly to backend revenue, delivering clean CAC, LTV, and ROAS metrics.
Frequently Asked Questions
What is the main difference between a marketing KPI and a vanity metric?
A marketing KPI measures a direct financial outcome (revenue, profit, unit economics) that informs capital allocation decisions. A vanity metric measures surface-level activity (impressions, likes, traffic) that looks good on a dashboard but cannot be linked to the P&L statement.
Which marketing KPIs best prove true ROI?
The five core KPIs that prove ROI are Customer Acquisition Cost (CAC), Customer Lifetime Value (LTV), the LTV:CAC Ratio, CAC Payback Period, and Marketing-Influenced Revenue.
What is a good LTV:CAC ratio benchmark?
A healthy benchmark is 3:1 or higher [³]. A 3:1 ratio indicates that a customer generates three times more lifetime gross profit than the cost required to acquire them. Ratios below 3:1 point to thin margins, while ratios above 5:1 suggest a brand can safely spend more to acquire market share.
Are impressions and email open rates completely useless?
No. They serve as secondary diagnostic metrics for campaign optimization (e.g., testing ad creative or subject lines). However, they should never be presented to executive leadership as primary proof of marketing ROI.
How many KPIs should be included on an executive scorecard?
Limit executive reporting to five financial metrics. A focused 5-metric scorecard based on verified first-party data provides clearer strategic direction than a sprawling dashboard of secondary metrics.
Sources & References
- Firework, “Marketing ROI Statistics: 30+ Stats to Boost Your Strategy in 2025,” Firework Insights.
- DigGrowth, “Top KPIs Every CMO Should Track To Prove Marketing’s ROI,” DigGrowth Data Management.
- Harvard Business School Online, “LTV/CAC Ratio: What It Is and How to Calculate It,” HBS Online Business Insights.
- YourGrowthPartner, “Customer Acquisition Cost (CAC) Benchmarks by Industry: 2025 Data,” Growth Analytics Research.
- Triple Whale, “What Is a Good ROAS? 2025 Industry Benchmarks and Strategies,” Triple Whale Benchmarks.