Executive Summary: Customer Lifetime Value (LTV or CLV) measures the total net profit a business generates from a single customer across their entire purchasing relationship. Evaluating marketing performance on first-purchase ROAS alone systematically undervalues high-retention channels. By calculating LTV using net contribution margin and pairing it with Customer Acquisition Cost (LTV:CAC), brands can prove long-term ROI and safely scale ad spend.
Key Takeaways
- Profit, Not Revenue: Calculating LTV on gross revenue overstates customer value by 50% to 70% [³]. Always multiply lifetime revenue by your contribution margin to get true profit LTV [³].
- The 3:1 Benchmark: An LTV:CAC ratio of 3:1 is the standard benchmark for healthy, sustainable growth across B2B SaaS and e-commerce brands [²] [⁵].
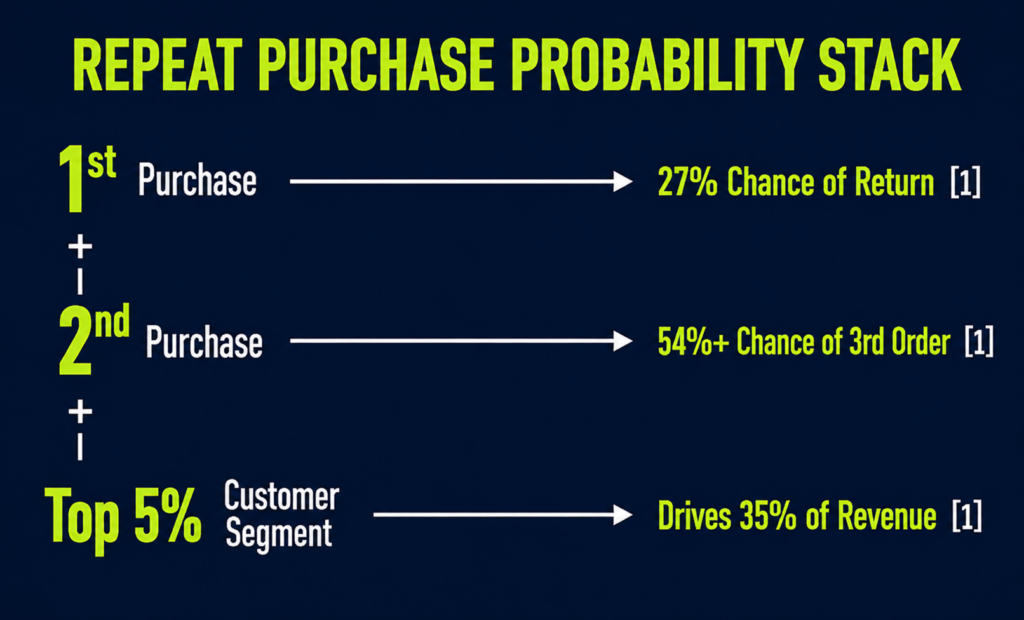
- The Repeat Purchase Jump: A first-time buyer has roughly a 27% chance of returning; after a second purchase, that probability jumps to 54% or higher [¹].
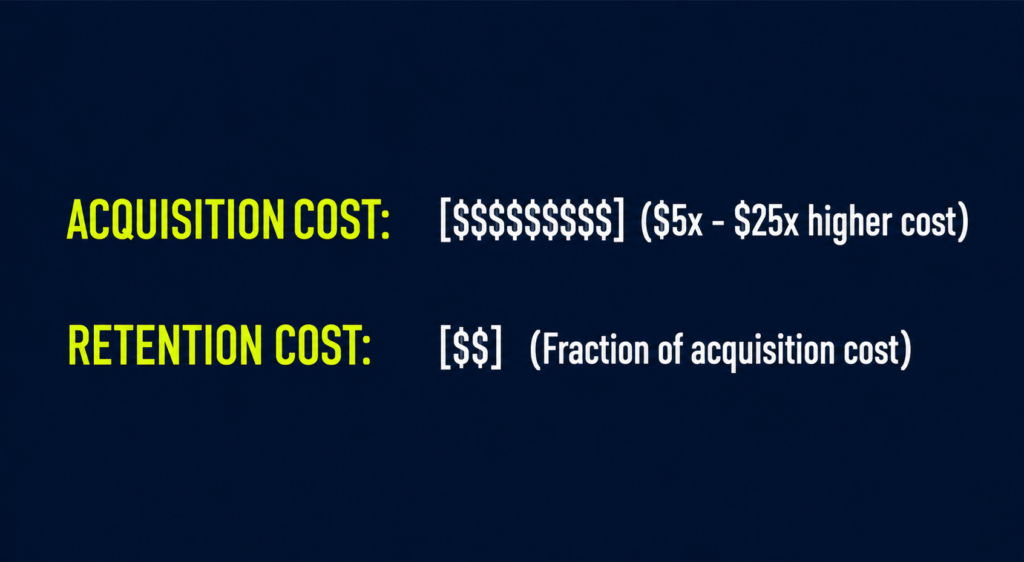
- Retention Drives Profitability: Retaining existing customers is 5x to 25x cheaper than acquiring new ones [⁴], and a 5% increase in retention can raise net profits by 25% to 95% [⁴].
- Concentration of Revenue: Existing customers generate 65% of total company revenue [⁴], with the top 5% of e-commerce buyers driving roughly 35% of overall sales [¹].
What Customer Lifetime Value Actually Measures
Customer Lifetime Value (LTV) is a top-down financial metric that quantifies the net profit generated by a customer from their first transaction through their final churn point. Unlike return on ad spend (ROAS), which measures immediate first-order revenue, LTV captures the compounding financial return of the entire customer relationship.
Judging ad performance strictly on first-purchase ROAS creates a systematic bias:
- It penalizes high-LTV channels: Channels that bring in loyal, multi-year buyers often have higher initial acquisition costs that look break-even on Day 1.
- It over-funds one-and-done buyers: Channels offering cheap first-click orders often yield zero repeat purchases, leading to long-term margin erosion.
- It ignores revenue concentration: Existing buyers generate 65% of corporate revenue [⁴] and spend 67% more per order than new buyers [⁴].
How to Calculate Customer Lifetime Value: A 5-Step Framework
Calculating actionable LTV does not require predictive machine-learning models. It requires accurate historical data across five core variables.
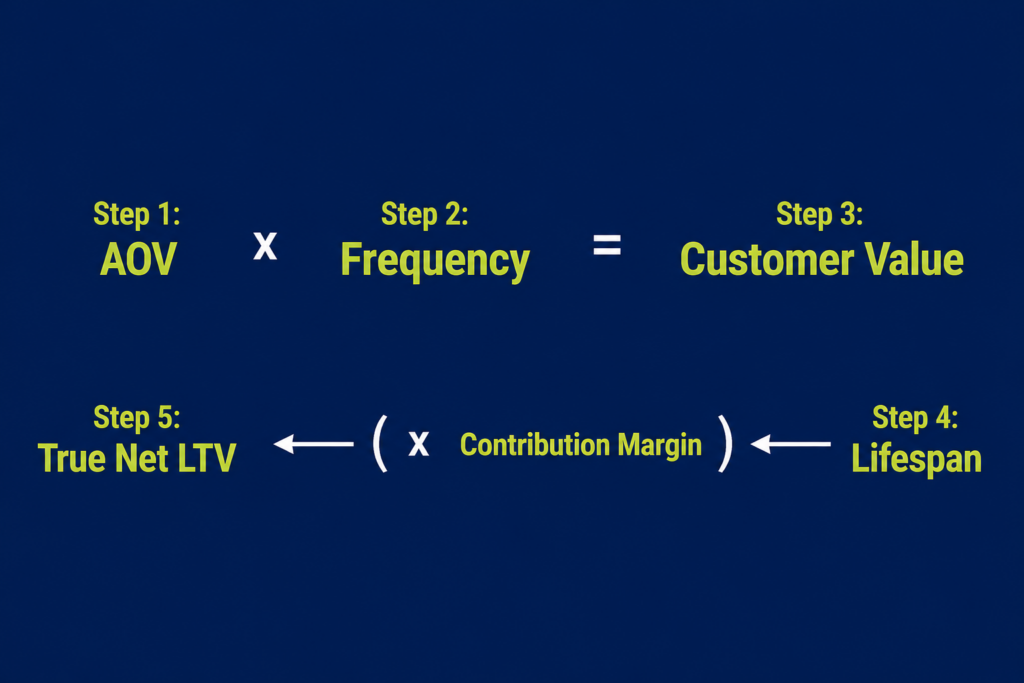
The LTV Profit Formula

Where:
- AOV = Average Order Value
- f = Purchase Frequency per Period
- t = Average Customer Lifespan (in years/periods)
Step-by-Step Calculation Breakdown
- Calculate Average Order Value (AOV): Divide total revenue by total order volume over a specific timeframe (e.g., $500,000 / 5,000 orders = $10 AOV).
- Determine Purchase Frequency ($f$): Divide total order count by unique customer count within that period (e.g., $5,000 orders / 2,000 customers = 2.5 orders/year).
- Calculate Annual Customer Value: Multiply AOV by Purchase Frequency ($100 x 2.5 = $250/year).
- Multiply by Average Customer Lifespan ($t$): Multiply annual customer value by the average number of years a customer remains active (e.g., $250 x 3 years = $750 Lifetime Revenue).
- Apply Contribution Margin (Mandatory): Multiply Lifetime Revenue by your net margin percentage after deducting Cost of Goods Sold (COGS), shipping, and fulfillment costs.
Formula Example:
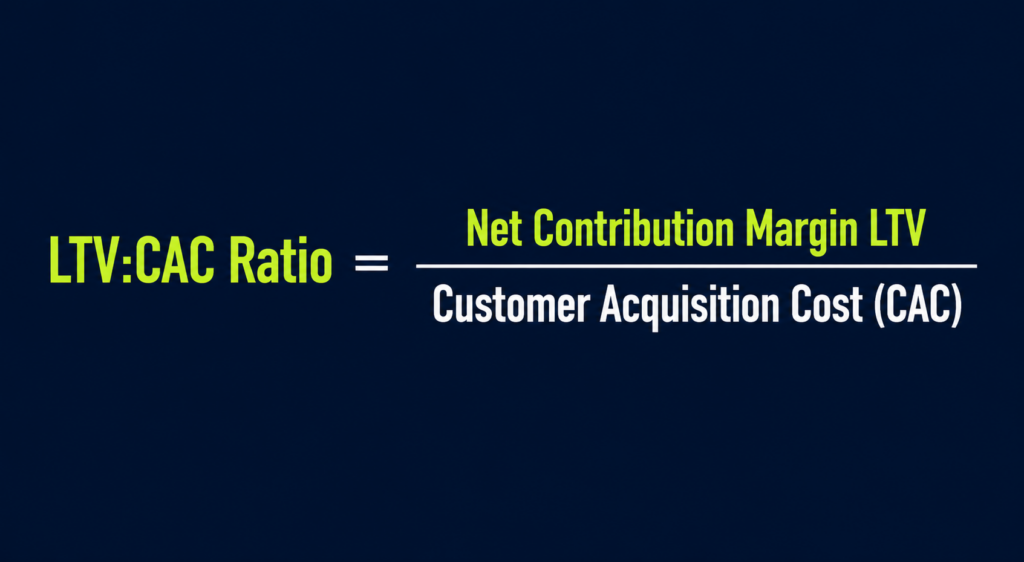
Skipping Step 5 and reporting LTV on top-line revenue overstates customer financial value by 50% to 70% [³].
The LTV to CAC Ratio: The Benchmark for Scaling
LTV reveals customer worth; Customer Acquisition Cost (CAC) reveals what you paid to secure them. Expressing these together as the LTV:CAC Ratio delivers the ultimate test of business model health.
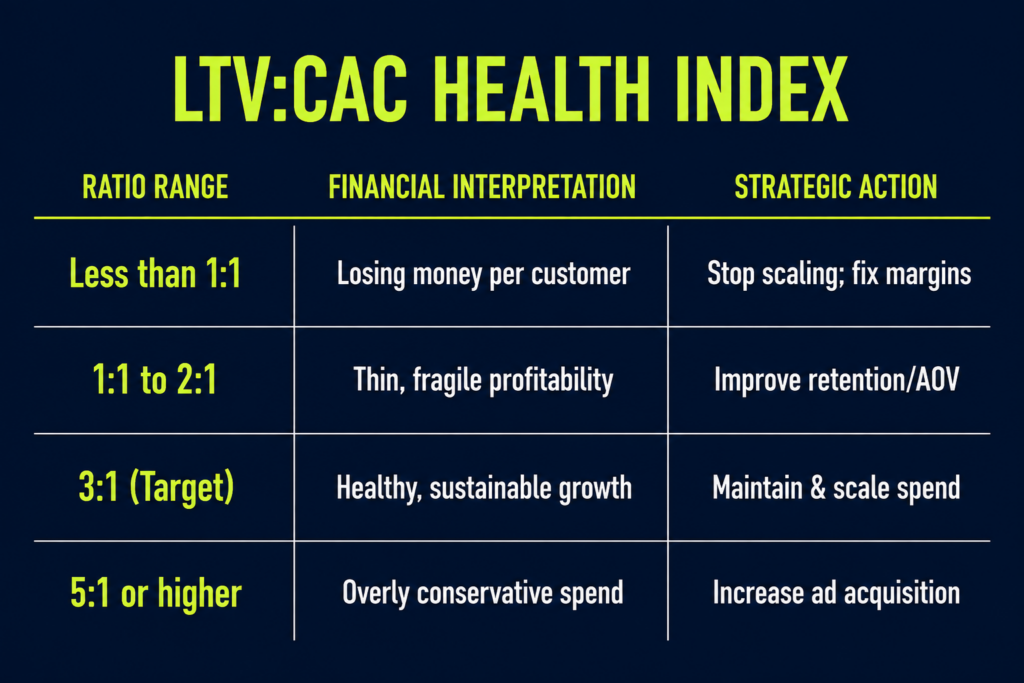
Industry Benchmarks
- B2B SaaS: Median LTV:CAC stands at 3.2:1 across 939 analyzed companies [²].
- Direct-to-Consumer (DTC) / E-Commerce: Healthy verified-cohort brands operate between 2.5:1 and 4:1 [⁵].
- The Oversharpening Trap: An LTV:CAC above 5:1 often indicates underinvestment. If margins are high, businesses should spend more aggressively to capture market share from competitors looking only at immediate ROAS.
Why Retention Is Your Primary LTV Lever
Improving retention is the fastest, highest-margin method to increase LTV without escalating paid ad costs.
The Economic Power of Repeat Buyers:
- Lower Cost Basis: Retaining an existing buyer is 5 to 25 times less expensive than acquiring a net-new buyer [⁴].
- Compounding Profitability: A modest 5% increase in retention yields a 25% to 95% boost in total profits [⁴].
- Owned Channel Efficiency: Lifecycle channels (email, SMS, loyalty programs) drive repeat purchases at near-zero incremental ad cost. Loyalty program members generate 12% to 18% higher revenue than non-members [¹].
Using LTV to Drive Ad Spend Decisions
Transitioning from first-order ROAS to cohort LTV transforms media buying strategy:
- Outbid Competitors Safely: Knowing a customer yields $\$300$ in net margin over three years empowers marketing teams to set higher maximum CAC limits in ad auctions, outbidding competitors constrained by single-order economics.
- Segment-Level Allocation: Blended LTV obscures critical channel nuances. Calculating LTV by channel, campaign, or landing page often reveals that “expensive” channels yield the highest multi-year margins.
- Executive Alignment: Reporting LTV tied to CAC translates marketing execution directly into board-level growth metrics, moving conversations away from vanity metrics like clicks and traffic.
To align your LTV insights with broader attribution systems, explore our guide on cookieless conversion tracking setups.
4 Common LTV Calculation Mistakes
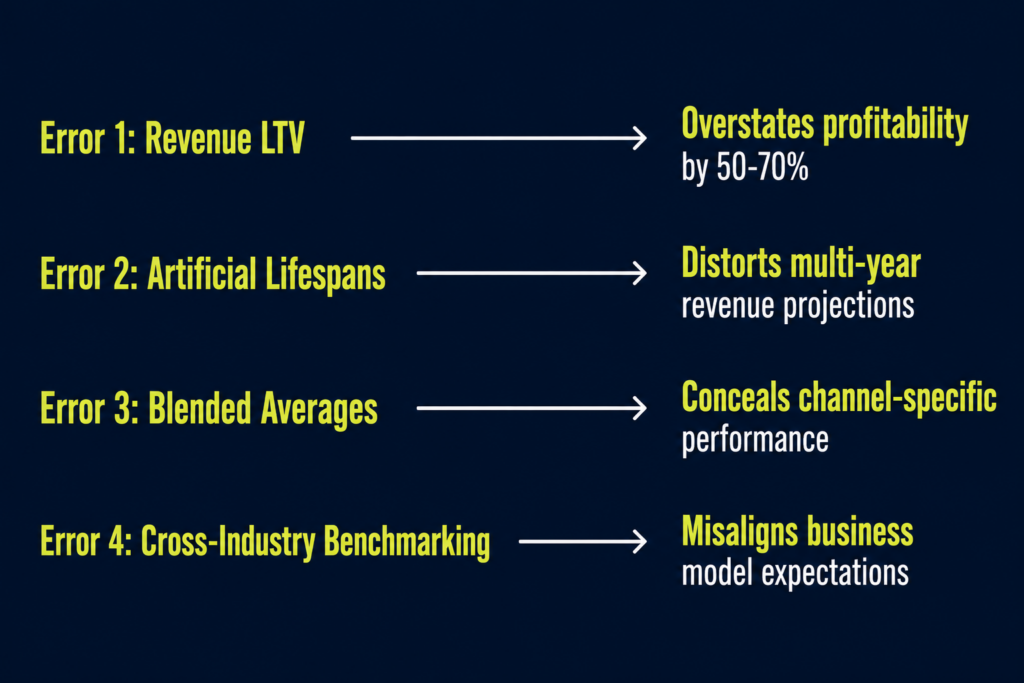
- Error 1: Using Top-Line Revenue Instead of Contribution Margin: Calculating LTV on gross revenue ignores COGS, shipping, pick/pack fees, and platform costs [³].
- Error 2: Setting Unrealistic Lifespan Expectations: Extending customer lifespan assumptions from 2 years to 5 years without historical cohort proof artificially inflates model performance.
- Error 3: Relying on a Single Blended LTV: Averaging high-value wholesale buyers with one-time discount shoppers hides the actionable insights needed to optimize media spend.
- Error 4: Flawed Attribution Data: Failing to accurately link returning customers to their original acquisition source renders channel-level LTV calculations unreliable.
Partner with National Positions for Data-Driven Scaling
Calculating, analyzing, and acting on LTV requires clean data structures and continuous cohort tracking.
National Positions empowers brands with end-to-end performance visibility:
- 22+ Years of Growth Analytics: Successfully optimizing marketing investments for over 300 e-commerce and SMB brands.
- Google Premier Partner Leadership: Recognized in the top tier of performance agencies worldwide.
- The PACE Framework: Our holistic methodology (Plan, Analyze, Convert, Expand) centers the Expand phase on customer retention, repurchase rates, and maximizing LTV.
- First-Party Attribution via AdBeacon: Our proprietary first-party attribution platform, AdBeacon, connects individual user purchases back to their initial acquisition source, delivering bulletproof, channel-specific LTV:CAC metrics.
Frequently Asked Questions
What is the formula for calculating Customer Lifetime Value (LTV)?
Multiply Average Order Value (AOV) by Purchase Frequency ($f$) to find annual customer value. Multiply that figure by Average Customer Lifespan ($t$), then multiply by your net Contribution Margin percentage:

What is considered a good LTV:CAC ratio?
An LTV:CAC ratio of 3:1 is widely considered the optimal benchmark for healthy growth [²] [⁵]. A ratio below 1:1 indicates net losses on customer acquisition, while a ratio above 5:1 suggests underinvestment in marketing scale.
Why must LTV be calculated using profit margin instead of revenue?
Calculating LTV on revenue ignores variable operational costs (COGS, fulfillment, shipping). Net contribution margin reflects the actual capital left over to reinvest in customer acquisition [³].
How does LTV differ from ROAS?
ROAS (Return on Ad Spend) measures immediate revenue generated from a specific ad campaign, usually focusing on the initial purchase. LTV measures total net profit generated across the entire multi-year customer relationship.
What is the most effective lever to increase LTV?
Customer retention. Increasing retention rates by 5% can boost net business profits by 25% to 95% [⁴], as repeat purchases carry zero additional acquisition costs.
Sources & References
- Rivo, “Customer Lifetime Value (CLV): 25 Ecommerce Calculation & Benchmark Statistics,” Rivo Analytics.
- Optif.ai, “B2B SaaS LTV Benchmarks, 939 Companies by Segment and LTV to CAC Ratio,” Optif Intelligence.
- Eightx, “LTV:CAC for DTC (Formula, Benchmarks, Why 3:1 Is Wrong),” Eightx Growth Research.
- Post Affiliate Pro, “Why Customer Retention Costs 5x Less Than Acquisition,” Post Affiliate Pro Blog.
- Qubit Capital, “Optimal LTV/CAC Ratios for E-Commerce Seed Funding Success,” Qubit Capital Research.