ROAS measures the revenue attributed to advertising compared with media spend. ROI measures the profit generated after the applicable costs are deducted. A campaign can produce an impressive ROAS while delivering little profit or even losing money.
ROAS remains useful for comparing campaigns, adjusting bids, testing audiences, and reallocating media budgets. It cannot confirm profitability on its own because it does not account for product costs, fulfillment, fees, labor, overhead, attribution quality, or the revenue that would have occurred without advertising.
Businesses should use ROAS for tactical advertising decisions and ROI for broader budget and profitability decisions.
Key Takeaways
- ROAS measures advertising efficiency by comparing attributed revenue with ad spend.
- ROI measures profitability after the costs included in the analysis are deducted.
- A high ROAS does not guarantee a profitable campaign.
- Break-even ROAS should be based on contribution margin, not an arbitrary industry benchmark.
- First-order ROAS and customer-lifetime-value ROAS answer different questions.
- Branded search, retargeting, and overlapping attribution can inflate platform-reported returns.
- ROAS helps media teams optimize campaigns, while ROI helps executives decide where to invest.
- Incrementality testing helps determine how much revenue advertising actually caused.
What Is ROAS?
Return on ad spend, or ROAS, measures how much advertising-attributed revenue a business generates for every dollar spent on media.
The formula is:
ROAS = Advertising-Attributed Revenue ÷ Ad Spend
If a campaign costs $10,000 and generates $40,000 in attributed revenue:
$40,000 ÷ $10,000 = 4.0x ROAS
The campaign generated four dollars in attributed revenue for every advertising dollar spent.
Amazon Ads defines ROAS using the same basic relationship between advertising sales and advertising spend.[¹] Marketers may express the result as 4.0x, 4:1, or 400%.
What ROAS Can Tell You
ROAS can help media teams:
- Compare campaigns or ad groups
- Evaluate audiences and creative assets
- Adjust bids and budgets
- Monitor short-term advertising efficiency
- Identify changes in attributed revenue
- Set automated bidding targets
- Compare performance within the same channel
ROAS is especially useful when campaigns use consistent attribution settings, conversion definitions, margins, and reporting periods.
What ROAS Does Not Tell You
ROAS does not automatically account for:
- Cost of goods sold
- Fulfillment and shipping
- Payment-processing fees
- Discounts and returns
- Sales commissions
- Creative-production expenses
- Agency or internal labor
- Marketing technology
- Operating overhead
- Customer quality
- Repeat-purchase behavior
- Attribution overlap
- Incremental sales lift
ROAS treats attributed revenue as the return. It does not show how much of that revenue the business retained as profit.
What Is ROI?
Return on investment, or ROI, measures the profit generated relative to the total applicable investment.
The formula is:
ROI = Net Profit ÷ Total Investment × 100
It can also be written as:
ROI = (Revenue − Total Applicable Costs) ÷ Total Applicable Costs × 100
The term “total applicable costs” must be clearly defined. A campaign-level ROI analysis might include ad spend, product costs, fulfillment, agency fees, creative costs, sales labor, and technology. A company-level calculation may also allocate salaries, rent, and other overhead.
This is why two businesses can report different ROI figures from similar campaigns. One may calculate ROI using ad spend and direct variable costs, while another includes a wider range of operating expenses.
A useful ROI report should always state:
- The revenue included
- The costs included
- The reporting period
- The attribution method
- How refunds and cancellations were treated
- How recurring revenue was valued
Without those definitions, an ROI percentage can appear more precise than it really is.
ROAS vs. ROI: What Is the Difference?
ROAS is an advertising-efficiency metric. ROI is a profitability metric.
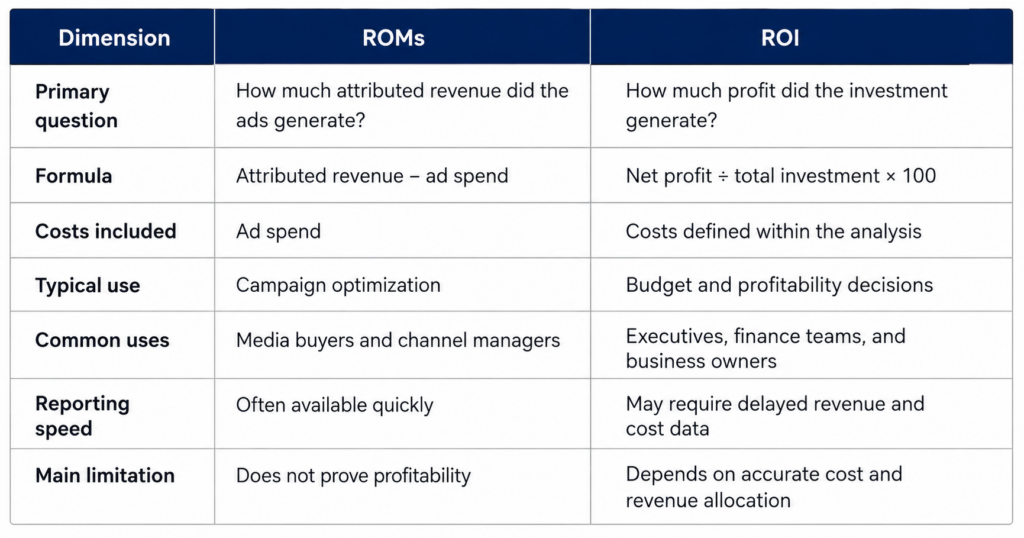
Neither metric replaces the other. The mistake is using ROAS as evidence of profit or relying on a broad ROI figure for daily campaign optimization.
Use ROAS to steer advertising activity. Use ROI to determine if that activity creates financial value.
How a 4.0x ROAS Can Produce a 13.6% ROI
Consider an e-commerce campaign with the following results:
- Revenue: $100,000
- Ad spend: $25,000
- Cost of goods sold: $45,000
- Fulfillment and processing: $10,000
- Creative, technology, and agency costs: $8,000
Total costs equal $88,000:
$25,000 + $45,000 + $10,000 + $8,000 = $88,000
Net profit equals $12,000:
$100,000 − $88,000 = $12,000
ROAS equals 4.0x:
$100,000 ÷ $25,000 = 4.0x
ROI equals approximately 13.6%:
$12,000 ÷ $88,000 × 100 = 13.6%
The 4.0x ROAS sounds much stronger than the 13.6% ROI because the two numbers measure different outcomes. ROAS compares revenue only with ad spend. ROI evaluates the remaining profit against all costs included in the calculation.
A modest change in margin could make the same 4.0x ROAS unprofitable. If product, return, and fulfillment costs increased by $15,000, total costs would reach $103,000. The campaign would still report 4.0x ROAS, but the business would lose $3,000.
How to Calculate Break-Even ROAS
Break-even ROAS is the minimum advertising return required to cover the costs included in the margin calculation.
The formula is:
Break-Even ROAS = 1 ÷ Contribution Margin
Contribution margin is the percentage of revenue remaining after applicable variable costs but before advertising and fixed overhead.
Those variable costs may include:
- Cost of goods sold
- Packaging
- Fulfillment
- Shipping subsidies
- Transaction fees
- Returns and refunds
- Variable sales commissions
Suppose a product sells for $100 and its non-advertising variable costs total $60. The business retains $40 before advertising.
Its contribution margin is:
$40 ÷ $100 = 40%
Its break-even ROAS is:
1 ÷ 0.40 = 2.5x
At 2.5x ROAS, $40 in ad spend generates $100 in revenue. The remaining $60 covers the variable costs included in the calculation.
A result above 2.5x produces a positive contribution after advertising. It does not necessarily mean the entire company is profitable. Salaries, rent, software, professional services, and other fixed expenses may require the business to set a higher target.
Break-Even ROAS by Contribution Margin
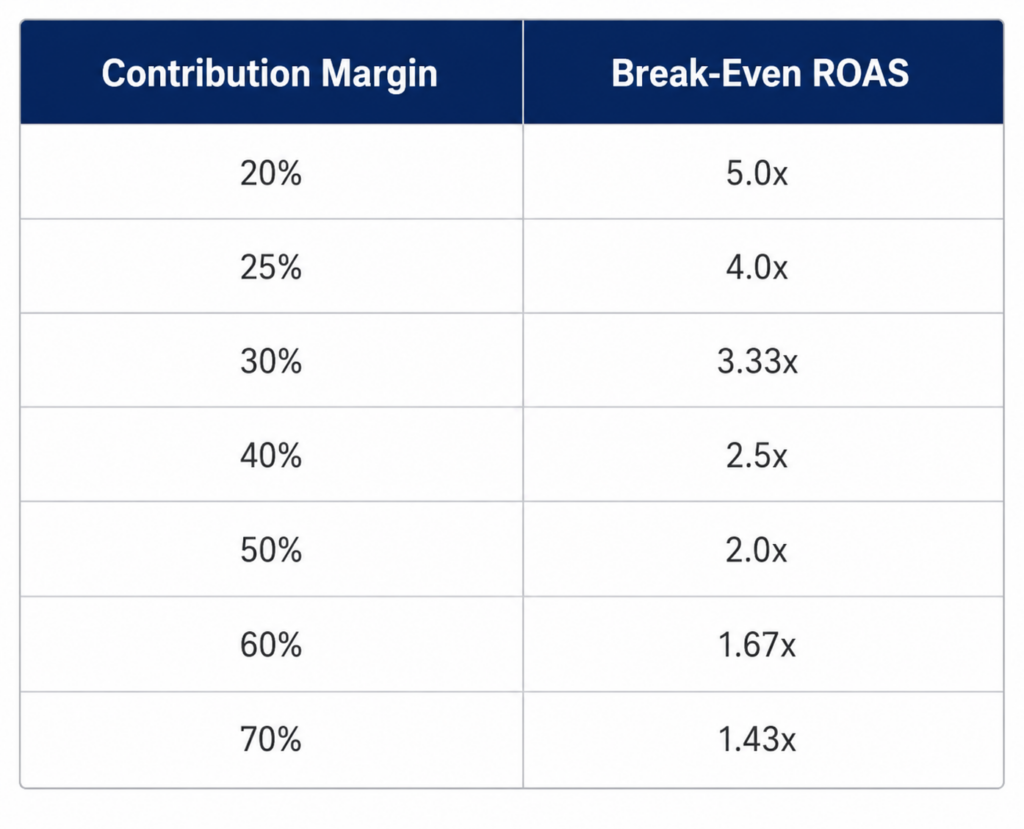
This is why universal ROAS benchmarks provide limited guidance. A 3.0x ROAS may be profitable for a business with a 60% contribution margin and unsustainable for one with a 25% margin.
How to Set a Target ROAS
Break-even ROAS establishes the floor. Target ROAS should reflect the contribution or profit the company wants to retain after advertising.
The formula is:
Target ROAS = 1 ÷ (Contribution Margin − Desired Post-Ad Contribution Margin)
Assume a company has a 50% contribution margin and wants to retain 15% of revenue after advertising.
1 ÷ (0.50 − 0.15) = 2.86x
The company should target approximately 2.86x ROAS under those assumptions.
The calculation should be completed separately for product groups, services, regions, or customer segments with meaningfully different margins. A single account-wide target can direct too much budget toward high-revenue products that generate weak profit.
First-Order ROAS vs. Customer-Lifetime-Value ROAS
Some businesses can acquire customers below the first-order break-even point because those customers generate additional profit through renewals or repeat purchases.
That does not make first-order profitability irrelevant. It creates two different measurement views.
First-Order Break-Even ROAS
This calculation uses revenue and contribution from the initial transaction. It answers:
Does the first purchase recover its acquisition cost?
Customer-Level Break-Even ROAS
This calculation incorporates validated profit from repeat purchases over a defined period. It answers:
Does the customer relationship recover its acquisition cost?
Customer-lifetime-value assumptions should be based on observed cohorts, not projected revenue alone. A reliable analysis accounts for:
- Repeat-purchase rate
- Time between purchases
- Churn
- Refunds
- Future fulfillment costs
- Gross or contribution margin
- Discounting
- Customer-service expenses
- The time required to recover acquisition cost
A campaign may support long-term growth while producing a weak first-order ROAS. The business still needs enough cash flow to support the payback period.
How to Measure ROI for Lead-Generation Campaigns
Lead-generation businesses cannot rely on form submissions or platform-assigned lead values as proof of revenue.
A useful calculation connects advertising activity with qualified leads, closed customers, recognized revenue, and profit.
Consider this example:
- Ad spend: $20,000
- Leads generated: 200
- Qualified leads: 80
- New customers: 12
- Recognized revenue: $120,000
- Gross profit from those customers: $60,000
- Total marketing and sales costs: $35,000
Net profit is:
$60,000 − $35,000 = $25,000
ROI is:
$25,000 ÷ $35,000 × 100 = 71.4%
This analysis also reveals several performance rates:
- Cost per lead: $100
- Cost per qualified lead: $250
- Customer acquisition cost: approximately $2,917
- Lead-to-customer rate: 6%
- Qualified-lead-to-customer rate: 15%
Reporting 200 conversions would hide the differences among inquiries, qualified opportunities, and paying customers. A campaign producing fewer leads may generate a stronger ROI if those leads close at a higher rate or produce greater customer value.
Lead-generation measurement should connect ad-platform identifiers and campaign information with the CRM, sales pipeline, and revenue system.
Why High ROAS Can Be Misleading
ROAS becomes unreliable when attributed revenue is treated as revenue caused by advertising.
Retargeting Can Claim Existing Demand
Retargeting reaches people who have already visited a website, viewed a product, or started the purchase process. Some of those customers would have returned without another paid impression.
The platform may attribute the conversion to retargeting even when the ad had little effect on the final decision.
Branded Search Can Capture Existing Intent
Someone searching directly for a company’s name already demonstrates strong intent. A branded paid-search campaign may report a high ROAS by receiving credit for customers who could have reached the website through an organic result, direct visit, map listing, or previous marketing interaction.
Branded campaigns can still provide value through message control, competitor defense, promotions, and additional search-result coverage. Their reported ROAS should not automatically be interpreted as fully incremental.
Platforms Can Claim the Same Conversion
A customer might see a Meta ad, click a Google ad, return through email, and purchase directly. Meta, Google Ads, and an email platform may each claim credit under their own attribution rules.
Adding the revenue reported by every platform can produce a total that exceeds the company’s actual revenue. This is a sign of overlapping attribution, not extraordinary performance.
Average ROAS Can Hide Diminishing Returns
A campaign with a historical 5.0x ROAS may not maintain that efficiency as its budget increases. The best audiences may already be saturated, and the next portion of spending may produce only a 2.0x return.
Marginal ROAS measures the revenue generated by the next increment of ad spend. It is often more useful than average ROAS when deciding how far a campaign can scale.
Revenue Quality Can Vary
Two campaigns can generate the same revenue while producing different financial outcomes.
One campaign might attract:
- High-return customers
- One-time discount buyers
- Low-margin orders
- Customers who frequently cancel
- Leads with poor close rates
The other may attract customers with better margins, stronger retention, and lower servicing costs. Standard ROAS treats their initial revenue as equivalent.
Attribution vs. Incrementality
Attribution assigns conversion credit to marketing touchpoints. Incrementality measures the additional outcomes caused by marketing.
Google describes incrementality testing as a controlled experiment that compares groups exposed to marketing with groups that are not exposed.[²] The comparison helps estimate what would have happened without the campaign.
Common incrementality approaches include:
- Geographic holdout tests
- Audience holdout tests
- Conversion-lift studies
- Matched-market experiments
- Spend increase or reduction tests
- Time-based tests with appropriate controls
Incrementality is particularly valuable for:
- Branded search
- Retargeting
- Upper-funnel campaigns
- Connected TV
- Influencer marketing
- Channels with view-through attribution
- Campaigns that overlap heavily with other media
Attribution helps organize conversion credit. Incrementality helps determine causal impact. Mature measurement programs use both.
Why Google Ads, Meta, GA4, and Your CRM Show Different ROAS
Different platforms can report different results for the same campaign because they use different data, attribution rules, and reporting methods.
Common causes include:
- Attribution models
- Lookback windows
- View-through conversions
- Modeled conversions
- Cross-device behavior
- Consent-related data loss
- Click-date versus conversion-date reporting
- Time-zone settings
- Currency conversion
- Duplicate events
- Refunds and cancellations
- Offline purchases
- Delayed sales
- Different customer identities
None of these systems necessarily provides the entire picture.
A practical reporting hierarchy is:
- Use ad-platform data for daily campaign optimization.
- Use analytics data to evaluate onsite behavior and cross-channel journeys.
- Use CRM and commerce systems to confirm customers and recognized revenue.
- Use finance-approved margin and cost data to calculate ROI.
- Use controlled experiments to estimate incremental lift.
For lead-generation companies, conversion tracking should extend beyond the form submission. Qualified-lead status, opportunity value, closed revenue, and sales-cycle length all affect the final return.
ROAS Is Only One Part of the Measurement Framework
Several related metrics can provide a clearer view of advertising performance.
Profit on Ad Spend
Profit on ad spend, often called POAS, compares gross or contribution profit with advertising spend.
POAS = Attributed Contribution Profit ÷ Ad Spend
POAS is closer to profitability than standard ROAS because it accounts for margin. It still may not include fixed overhead or every marketing cost.
Marketing Efficiency Ratio
Marketing efficiency ratio, or MER, compares total revenue with total advertising spend.
MER = Total Revenue ÷ Total Ad Spend
MER provides a blended business-level view. It can be useful when channel attribution is incomplete or overlapping, but it cannot reveal the incremental contribution of each channel.
Customer Acquisition Cost
CAC measures how much the business spends to acquire a new customer.
CAC = Total Sales and Marketing Costs ÷ New Customers Acquired
The scope of “sales and marketing costs” should remain consistent across reporting periods.
Customer Lifetime Value to CAC
LTV:CAC compares expected customer value with acquisition cost. It is most useful when lifetime value is based on customer cohorts and contribution profit rather than gross revenue.
CAC Payback Period
CAC payback period measures how long it takes to recover acquisition costs from customer contribution. This matters for subscription, repeat-purchase, and contract-based businesses.
Incremental ROAS
Incremental ROAS compares additional revenue caused by advertising with ad spend.
Incremental ROAS = Incremental Revenue ÷ Ad Spend
A campaign can have strong attributed ROAS and weak incremental ROAS if many attributed customers would have converted without the campaign.
Incremental ROI
Incremental ROI measures the profit caused by marketing relative to its cost.
Incremental ROI = Incremental Net Profit ÷ Incremental Investment × 100
This is one of the strongest metrics for cross-channel budget decisions, though it generally requires experimentation or advanced modeling.
Which Marketing Metric Should You Use?
The right metric depends on the decision being made.
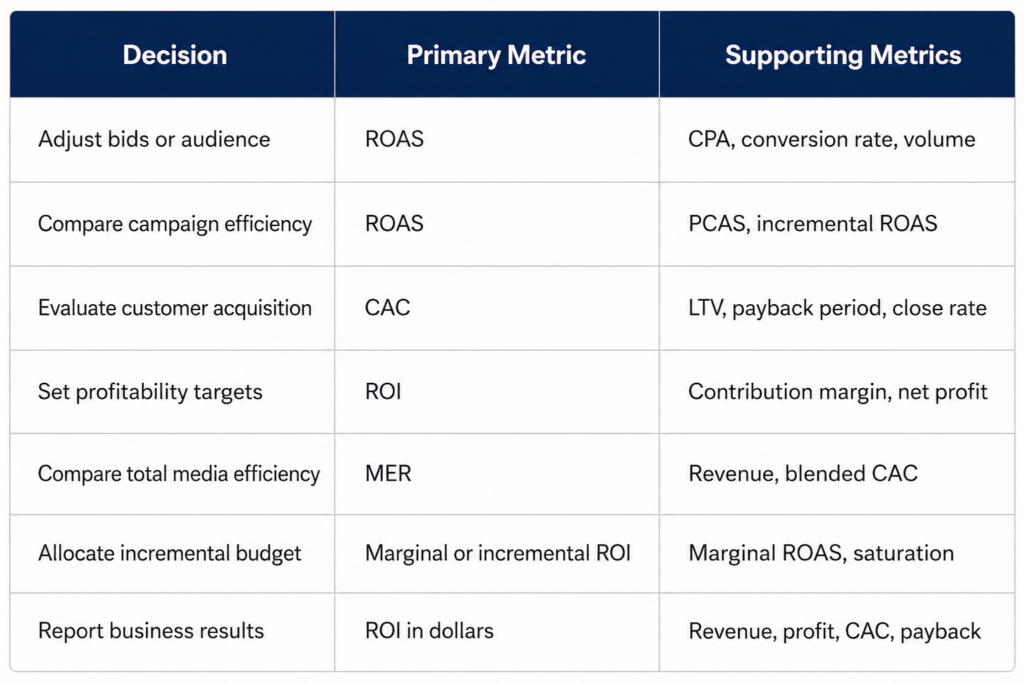
Media teams may review ROAS daily or weekly. ROI often requires a longer reporting window because returns, lead qualification, closed sales, and recurring revenue take time to develop.
Which Number Should You Report?
Report both ROAS and ROI, but use each metric for a different audience and purpose.
Report ROAS to your media team and channel managers. It changes quickly enough to guide day-to-day campaign decisions, including reallocating budgets, adjusting bids, comparing audiences, and reviewing channel-level performance. When a media buyer needs to decide which campaign receives additional budget, ROAS provides an efficient starting point. Improving paid-search performance starts with an accurate view of channel-level ROAS.
Report ROI to leadership, finance teams, and other stakeholders who control budgets. Present it in dollars alongside the percentage or ratio. For example:
Paid media produced $2.40 in gross profit for every dollar invested last quarter, representing a 140% return.
That statement communicates the financial result more clearly than reporting a 3.4x ROAS without information about costs or profit.
Marketing teams also need to explain how revenue was attributed and which costs were included in the ROI calculation. Funnel’s 2026 Marketing Intelligence Report found that 86% of in-house marketers and 79% of agency marketers struggle to determine each channel’s effect on overall performance.[⁸] This measurement gap makes validated attribution, CRM revenue, contribution-margin data, and consistent cost definitions especially important.
The takeaway is straightforward: report ROAS to your media team and ROI to leadership. Use incrementality and validated business data to determine how much value advertising actually created.
Improving the conversion side of the equation can strengthen both metrics. Learn how our conversion rate optimization services help businesses turn more paid traffic into qualified leads, customers, and revenue.
What You Need to Calculate Reliable Marketing ROI
Reliable measurement depends on the connection between advertising data, customer activity, revenue, and costs.
A strong measurement system may include:
- Accurate advertising-cost imports
- Consistent campaign naming
- Standardized UTM parameters
- First-party conversion tracking
- Server-side event collection where appropriate
- CRM source and campaign fields
- Offline-conversion imports
- Closed-revenue reporting
- Cost-of-goods and contribution-margin data
- Refund and cancellation adjustments
- Customer identity resolution
- Documented attribution windows
- Consistent conversion definitions
- Incrementality testing
- Finance-approved cost categories
The final reporting should also distinguish prospecting, retargeting, branded search, and existing-customer campaigns. Combining them can make account-level ROAS appear healthier than new-customer acquisition actually is.
How National Positions Connects Ad Spend to Business Results
National Positions helps businesses move from platform-reported conversions toward decisions based on qualified leads, recognized revenue, contribution margin, and customer value.
Depending on the company’s sales process and available data, this work may include:
- Auditing Google Ads, Meta, GA4, CRM, and commerce tracking
- Identifying duplicate or missing conversion events
- Connecting campaign activity with qualified leads and closed revenue
- Separating branded, retargeting, and prospecting performance
- Defining break-even and target ROAS by product or service
- Building first-order and customer-lifetime-value measurement views
- Evaluating attribution windows and cross-platform overlap
- Improving landing pages and conversion paths
- Testing incrementality where attribution is inconclusive
- Creating reporting for media teams, executives, and finance
Our PACE methodology, which stands for Plan, Analyze, Convert, and Expand, provides a framework for connecting campaign planning, measurement, conversion optimization, and profitable growth.
AdBeacon, our first-party attribution platform, helps consolidate conversion data and connect advertising activity with business outcomes. This gives companies a clearer measurement foundation than relying exclusively on the ROAS displayed inside each advertising platform.
Request a Complimentary ROAS-to-ROI Assessment
A high platform-reported ROAS does not always translate into a profitable marketing program.
National Positions can review your advertising and measurement setup, identify areas where reported ROAS may differ from business results, and outline the data required to establish more reliable profitability targets.
Schedule a complimentary consultation to learn where your reporting is clear, where attribution may be overstating performance, and what your business can improve next.
Frequently Asked Questions
What is the difference between ROAS and ROI?
ROAS compares advertising-attributed revenue with ad spend. ROI compares net profit with the total investment included in the analysis. ROAS evaluates advertising efficiency, while ROI evaluates profitability.
Is a 4.0x ROAS profitable?
A 4.0x ROAS may be profitable, but the result depends on contribution margin and other business costs. A company with a 40% contribution margin has a 2.5x first-order break-even ROAS. A company with a 20% margin needs a 5.0x ROAS to cover the included variable costs and ad spend.
Can ROAS increase while profit declines?
Yes. ROAS can rise while profit declines if product margins fall, return rates increase, fulfillment costs grow, or advertising shifts toward lower-margin products. It can also happen when platforms claim more attributed revenue without producing comparable incremental sales.
What costs should marketing ROI include?
Marketing ROI may include ad spend, product costs, shipping, fulfillment, payment fees, sales labor, creative production, technology, agency fees, and allocated overhead. The appropriate scope depends on the decision. Every ROI report should disclose which costs were included.
What is the difference between ROAS and POAS?
ROAS compares attributed revenue with ad spend. POAS compares attributed gross or contribution profit with ad spend. POAS accounts for margin, making it more useful for evaluating campaign-level profit contribution.
How does customer lifetime value affect target ROAS?
Validated customer lifetime value may allow a business to acquire customers below its first-order break-even point. The calculation should account for repeat-purchase rates, churn, future costs, margin, and the time required to recover acquisition spending.
Why does Google Ads show different revenue from GA4?
Google Ads and GA4 may use different attribution models, reporting dates, identity methods, conversion definitions, and lookback windows. Google Ads may also include conversions that receive different credit in GA4. CRM or commerce records should be used to confirm recognized revenue.
How do you calculate ROI for lead-generation campaigns?
Connect ad spend with qualified leads, closed customers, recognized revenue, gross or contribution profit, and sales costs. Then divide the resulting net profit by the total applicable investment and multiply by 100.
What is incremental ROAS?
Incremental ROAS measures the additional revenue caused by advertising divided by ad spend. It differs from attributed ROAS, which assigns credit according to platform or analytics rules without necessarily proving that the ad caused the sale.
Should I report ROAS or ROI to leadership?
Leadership should receive ROI, profit, CAC, and payback information when accurate data is available. Media teams should continue using ROAS and related campaign metrics for day-to-day optimization.
Sources
- Amazon Ads, “What Is Return on Ad Spend?”
- Google, “Use Incrementality Testing for Effective Marketing Measurement”
- AgencyAnalytics, “ROI vs. ROAS: How to Explain the Difference to Clients”
- Dynares, “ROI vs. ROAS: Track Profit, Not Vanity”
- Attribution, “Measuring and Optimizing Google Ads ROAS and ROI”
- Hustle Marketers, “ROAS vs. ROI”
- Measured, “What Is Incrementality in Marketing?”