Multi-touch attribution and media mix modeling evaluate marketing performance from different perspectives. Multi-touch attribution assigns conversion credit across recorded customer touchpoints. Media mix modeling estimates how changes in marketing investment contribute to changes in revenue, leads, or another business outcome.
Multi-touch attribution, or MTA, provides detailed journey and campaign insights. Media mix modeling, or MMM, supports broader budget planning by evaluating aggregate performance over time. MTA helps marketers optimize activity within channels, while MMM helps businesses allocate investment across channels.
Neither method provides a complete measurement system on its own. MTA depends on tracking coverage and identity resolution. MMM depends on historical variation, appropriate controls, and well-supported modeling assumptions. Many businesses benefit from combining both methods with incrementality testing.
MTA vs. MMM: The Direct Answer
Multi-touch attribution is best for analyzing identifiable customer journeys and optimizing campaigns at a detailed level. Media mix modeling is best for estimating channel contribution, diminishing returns, and cross-channel budget allocation using aggregate data.
Businesses with short, trackable digital journeys may begin with MTA. Companies investing across paid digital media, television, radio, podcasts, retail, and other channels may gain more strategic insight from MMM. Organizations that need both campaign-level optimization and cross-channel planning can use MTA and MMM together.
Key Takeaways
- MTA assigns credit to recorded touchpoints within customer journeys.
- MMM estimates how marketing activity contributes to an aggregate business outcome.
- MTA is generally more useful for tactical campaign optimization.
- MMM is generally more useful for strategic budget allocation and forecasting.
- MTA can incorporate some offline interactions when they are connected to known customers or accounts.
- MMM can evaluate offline channels when reliable spend, exposure, and outcome data are available.
- MMM results depend on model assumptions, data variation, and appropriate control variables.
- Incrementality experiments can validate or calibrate conclusions from both methods.
- A unified measurement program uses each method for the decisions it is best equipped to support.
What Is Multi-Touch Attribution?
Multi-touch attribution is a marketing measurement method that assigns conversion credit across multiple recorded interactions in a customer journey.
A customer might:
- Click a paid social advertisement.
- Find the company again through organic search.
- join an email list.
- Return through a paid-search advertisement.
- Complete a purchase.
An MTA model distributes credit among these interactions instead of assigning the entire conversion to the first or last touchpoint.
Common multi-touch attribution models include:
- Linear attribution
- Time-decay attribution
- Position-based attribution
- W-shaped attribution
- Full-path attribution
- Data-driven attribution
- Custom attribution
Each model can produce a different interpretation of the same journey. Linear attribution gives each touchpoint equal credit. Time-decay attribution favors recent interactions. Position-based attribution usually emphasizes the first and final touchpoints. Data-driven attribution estimates fractional credit from observed path data.
How Multi-Touch Attribution Works
MTA generally involves four stages.
1. Collect Interaction Data
The system gathers recorded events such as:
- Advertisement impressions
- Advertisement clicks
- Website visits
- Content views
- Email interactions
- Form submissions
- Phone calls
- Demonstration requests
- Purchases
- CRM status changes
Each event should include a reliable timestamp, source, campaign, and conversion identifier when available.
2. Connect Events Into Customer Journeys
The platform attempts to determine which events belong to the same customer, device, contact, or business account.
Possible identifiers include:
- First-party cookies
- Login credentials
- Customer IDs
- CRM contact records
- Email addresses
- Call-tracking records
- E-commerce order IDs
- Account identifiers
This stage becomes difficult when people switch devices, clear cookies, decline tracking, use multiple email addresses, or interact anonymously.
3. Apply an Attribution Model
The selected model assigns conversion credit to the recorded interactions.
A rule-based model uses predetermined percentages. A data-driven model uses statistical or machine-learning methods to estimate the contribution of each touchpoint from observed converting and non-converting paths.
4. Aggregate the Results
The platform combines journey-level results into reports by:
- Channel
- Campaign
- Ad set
- Advertisement
- Keyword
- Landing page
- Content asset
- Audience
- Customer segment
Marketers can use these reports to adjust bids, campaigns, creative, landing pages, and channel tactics.
What Questions Can MTA Answer?
MTA is useful for questions such as:
- Which campaigns appear frequently in converting journeys?
- Which channels initiate or support conversions?
- Which advertisements assist sales without receiving last-click credit?
- Which email sequences appear before qualified leads?
- Which landing pages contribute to high-value journeys?
- Which channels work together before conversion?
- Which campaigns should be investigated for tactical optimization?
MTA can provide timely, detailed reporting when the customer journey is sufficiently trackable.
Strengths of Multi-Touch Attribution
Detailed Campaign Reporting
MTA can provide campaign-, advertisement-, keyword-, and touchpoint-level insights that MMM may not reliably produce.
Faster Optimization
MTA reports can update daily or near real time. That makes the method useful for short-term campaign management.
Customer-Journey Visibility
Journey reporting can reveal the sequence of interactions that occurred before conversion. It may show that customers first discover a brand through social media, research through organic content, and return through paid search.
Accessible Starting Point
Many analytics, advertising, CRM, call-tracking, and attribution platforms already capture the data used for MTA. A business may be able to establish a basic model without building a dedicated statistical program.
Limitations of Multi-Touch Attribution
Incomplete Identity Resolution
MTA depends on connecting events to the same customer or account. Missing identifiers can fragment one journey into several unrelated records.
Tracking and Consent Restrictions
Browser controls, mobile privacy settings, advertising-platform restrictions, consent requirements, and cross-device behavior can reduce tracking coverage.
First-party data and server-side tracking can improve data collection, but they do not make every customer interaction observable.
Model Sensitivity
Different attribution models can assign substantially different credit to the same journey. The selected model contains assumptions about which interactions matter.
Limited Causal Evidence
A touchpoint appearing before a conversion does not prove that it caused the conversion. A branded search advertisement may receive credit from a customer who had already decided to purchase.
Limited Visibility Into Anonymous Offline Exposure
MTA can incorporate phone calls, event registrations, CRM activity, coupon codes, and point-of-sale transactions when those events connect to a customer record.
It usually cannot reconstruct anonymous exposure to a billboard, radio advertisement, television commercial, or offline conversation.
Limited Treatment of External Factors
Traditional MTA generally does not account for changes in:
- Seasonality
- Pricing
- Promotions
- Inventory
- Distribution
- Competitor activity
- Economic conditions
- Weather
- Baseline brand demand
These factors can affect sales without appearing as customer touchpoints.
What Is Media Mix Modeling?
Media mix modeling is an aggregate statistical approach used to estimate how marketing activity contributes to a business outcome over time.
The business outcome may be:
- Revenue
- Orders
- Qualified leads
- New customers
- Store visits
- Subscriptions
- App installations
- Profit
- Customer lifetime value
MMM typically analyzes media spending, impressions, reach, or frequency alongside the selected outcome. It may also include non-media variables that influence business performance.
Common inputs include:
- Paid-search spending
- Paid-social spending
- Television investment
- Radio investment
- Connected TV
- Podcasts
- Influencer marketing
- Email activity
- Promotions
- Pricing
- Holidays
- Distribution
- Inventory
- Competitor activity
- Economic variables
- Organic search demand
Modern MMM often uses Bayesian statistical techniques. Google’s Meridian framework, for example, is designed to estimate the causal impact of marketing while making the assumptions behind those estimates explicit.[¹]
How Media Mix Modeling Works
1. Define the Outcome
The organization selects the business result the model should explain. Revenue may be appropriate for e-commerce, while qualified leads or closed revenue may be more useful for a lead-generation company.
2. Collect Aggregate Data
The model uses observations across time, geography, or both. Weekly data is common, but the appropriate frequency depends on the business, sales cycle, and media activity.
3. Add Marketing and Control Variables
Marketing variables represent the channels or tactics being evaluated. Control variables represent other factors that could influence the outcome and potentially distort the estimated media effects.
4. Model Carryover and Diminishing Returns
MMM accounts for the possibility that advertising affects results after the initial exposure and that additional spending eventually produces smaller returns.
5. Estimate Contribution and Response
The model estimates channel contribution, return, response curves, and expected performance at different spending levels.
6. Test Budget Scenarios
The business can compare potential allocations and estimate how shifting spending among channels may affect results.
Important MMM Concepts
Adstock
Adstock represents the delayed or continuing effect of advertising.
A customer may not purchase during the same week they encounter a television campaign, podcast advertisement, or video. The influence can carry into later periods.
MMM uses an adstock transformation to estimate how quickly the effect builds and declines.
Saturation
Saturation occurs when additional investment in a channel produces progressively smaller gains.
The first $50,000 invested in a channel may generate a strong return. The next $50,000 may generate less. Eventually, the available audience, inventory, or demand can limit further growth.
Response Curve
A response curve shows the estimated relationship between channel investment and the resulting business outcome.
It can help identify:
- Efficient spending ranges
- Diminishing returns
- Potential saturation
- Opportunities to increase investment
- Channels that may be overfunded
Average ROI
Average ROI compares the total estimated return from a channel with its total investment.
It describes historical efficiency across the full spending level.
Marginal ROI
Marginal ROI estimates the expected return from the next dollar spent.
A channel can have a strong average ROI but a weak marginal ROI if current investment is already near saturation. Budget planning should consider both measures.
Baseline Demand
Baseline demand represents outcomes that may have occurred without the marketing activity included in the model.
It can reflect:
- Existing brand awareness
- Organic demand
- Repeat customers
- Distribution
- Product quality
- Long-term reputation
- Market conditions
Separating baseline demand from incremental media contribution is one of MMM’s most difficult tasks.
Confounder
A confounder affects both marketing activity and the business outcome.
Paid search provides a useful example. Search advertising often increases when organic demand is already rising. Revenue may also rise because more people want the product. Without an appropriate control for organic demand, a model may give paid search credit for sales associated with the demand increase.
Google identifies query volume as an important potential confounder when modeling paid search.[²]
Prior
A prior is information included in a Bayesian model before it analyzes the current data.
Priors can come from:
- Previous models
- Incrementality experiments
- Industry research
- Platform studies
- Established business knowledge
Priors should be documented and supported. Poorly chosen priors can bias results.
Credible Interval
An MMM estimate should include uncertainty.
Instead of reporting that a channel has an ROI of exactly 3.0, a Bayesian model might estimate a range of plausible values. A wide credible interval indicates greater uncertainty. A narrow interval indicates a more precise estimate under the model and its assumptions.
What Questions Can MMM Answer?
MMM is useful for questions such as:
- How much did each channel contribute to revenue?
- Which channels are approaching saturation?
- Where is the next marketing dollar likely to produce the highest return?
- How should next quarter’s budget be distributed?
- What could happen if total spending increases or decreases?
- How do promotions and seasonality affect results?
- How does offline-media investment compare with digital investment?
- What is the estimated incremental contribution of each channel?
- Which channels have strong average ROI but weak marginal ROI?
These are broader planning questions than those typically handled through MTA.
Strengths of Media Mix Modeling
Broader Channel Coverage
MMM can include paid digital media, traditional media, organic activity, promotions, and other measured business factors within the same analysis.
No Journey Reconstruction Required
MMM primarily uses aggregate data. It does not need to connect every interaction to an individual customer journey.
Strategic Budget Planning
Response curves and marginal ROI estimates can help businesses allocate budgets across channels.
External-Factor Controls
A properly specified model can account for seasonality, pricing, distribution, promotions, economic conditions, and other measurable influences.
Scenario Planning
MMM can estimate how different spending allocations may affect revenue or another selected KPI.
Limitations of Media Mix Modeling
MMM Does Not Automatically See Every Influence
A model can evaluate only the factors represented by its data and structure. Missing variables, inconsistent definitions, and poorly selected controls can distort the results.
Correlated Channels Can Be Difficult to Separate
If paid social, television, and search spending always rise and fall together, the model may struggle to determine the contribution of each one.
Consistent Spending Provides Limited Evidence
A channel with nearly identical spending every week provides little information about how results change at different investment levels.
Variation across time or geography helps the model estimate effects.
Historical Changes Can Complicate Analysis
Pricing changes, product launches, acquisitions, website migrations, market expansion, and inventory disruptions can make older data less comparable.
Causal Interpretation Requires Assumptions
Google describes MMM as a causal-inference methodology based on observational data. Valid interpretation requires appropriate controls, model structure, and transparent assumptions.[³]
Direct Validation Is Difficult
Google notes that directly validating causal quality requires well-designed experiments. Standard model-fit metrics alone cannot prove that the estimated marketing effects are correct.[⁴]
MMM Requires Specialized Expertise
Open-source tools have made the technology more accessible, but implementation still requires expertise in data preparation, statistics, causal inference, model validation, and business interpretation.
MTA vs. MMM Comparison
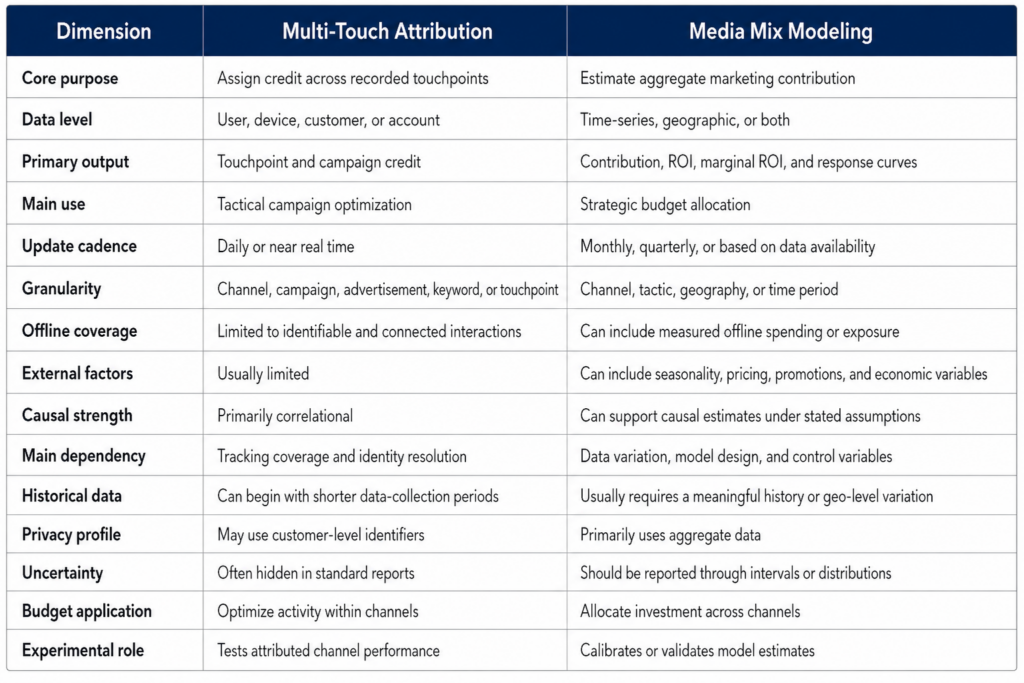
A Worked MTA and MMM Example
Consider an e-commerce company investing in:
- Paid search
- Paid social
- Connected TV
- Podcasts
- Influencer marketing
What MTA Could Reveal
MTA might show that many recorded customer journeys begin with paid social, include email, and end with branded search.
The marketing team could use that information to:
- Compare paid-social campaigns
- Identify common conversion paths
- Evaluate email sequences
- Review branded-search dependence
- Optimize advertisements and landing pages
- Find campaigns that assist conversions
MTA would have limited visibility into anonymous podcast and connected-TV exposure unless those interactions could be connected through another identifier or method.
What MMM Could Reveal
MMM could evaluate spending and performance across every included channel. It might estimate that:
- Connected TV creates a delayed sales effect.
- Paid social remains efficient at a higher budget.
- Branded search has a strong average ROI but limited marginal opportunity.
- Podcast investment has a wide credible interval because spending rarely changed.
- Email supports revenue but is partly influenced by prior customer acquisition.
- Promotions explain some of the revenue spikes previously credited to advertising.
The business could use those results to build quarterly budget scenarios.
What an Experiment Could Confirm
A geographic holdout could test whether reducing branded-search spending changes total sales. Another experiment could increase paid-social investment in selected markets.
The experimental results could then validate or calibrate the conclusions produced by MTA and MMM.
How Much Data Does MMM Require?
There is no universal historical-data requirement.
MMM feasibility depends on:
- Number of observations
- Reporting frequency
- Geographic granularity
- Number of modeled channels
- Variation in spending
- Channel correlation
- Seasonal patterns
- Business stability
- Sales-cycle length
- Available control variables
- Experimental evidence
- Model design
Two or more years of weekly data is a common starting point for a national time-series model. A geo-level model may obtain more statistical information from differences across regions and may support modeling with a shorter time range.
Historical length should not be the only criterion. Two years of unchanging channel budgets may provide less useful evidence than a shorter period with meaningful geographic and spending variation.
MTA Readiness Checklist
A business may be ready for MTA when it has:
- Clearly defined conversions
- Consistent UTM parameters
- Reliable website and app events
- Cross-domain tracking
- First-party customer identifiers
- CRM integration
- Call tracking
- Offline conversion imports
- Documented attribution windows
- Duplicate-event prevention
- Consent-based data collection
- Enough conversions for the selected model
- Consistent campaign naming
MMM Readiness Checklist
A business may be ready for MMM when it has:
- Consistent historical KPI data
- Channel-level spending or exposure data
- Weekly or daily observations
- Meaningful spending variation
- Geographic data when available
- Promotion and pricing records
- Seasonality and holiday variables
- Inventory and distribution data
- Consistent revenue definitions
- Documentation of major business changes
- Internal or external modeling expertise
- An identified set of potential controls and confounders
A Six-Step Framework for Choosing MTA, MMM, or Both
1. Define the Decision
Start with the decision the business needs to make.
Choose MTA for detailed campaign and journey questions. Choose MMM for cross-channel allocation, forecasting, and diminishing-return questions.
2. Evaluate Journey Tracking
Review the ability to connect website, advertising, CRM, call, and sales activity.
If customer journeys cannot be connected reliably, MTA may produce a fragmented picture.
3. Evaluate Historical Variation
Review changes in spending, channel mix, geography, promotions, and business outcomes.
MMM needs enough variation to distinguish marketing effects from other changes.
4. Document Business Changes
Identify pricing updates, product launches, market expansions, distribution changes, inventory problems, tracking migrations, and other events that could affect comparability.
5. Assess Technical Resources
Determine who will prepare data, specify the model, evaluate assumptions, interpret uncertainty, and translate results into budget decisions.
Running software is only one part of an MMM program.
6. Select the Measurement System
A smaller digital business may begin with MTA and first-party tracking.
A mature business with broad channel investment may prioritize MMM.
A multichannel organization that needs strategic planning and daily optimization may benefit from both methods, supported by incrementality experiments.
How Unified Marketing Measurement Works
Unified marketing measurement combines multiple methods within one decision framework.
A coordinated system can use:
- MTA for customer-journey analysis
- MTA for campaign and creative optimization
- MMM for channel contribution
- MMM for response curves and budget scenarios
- Incrementality experiments for causal validation
- Business metrics for revenue, profit, and customer value
The methods should share consistent definitions for:
- Revenue
- Conversions
- Customers
- Channels
- Reporting periods
- Geographic markets
- Marketing costs
- Attribution windows
- Business outcomes
Unified measurement does not require the methods to produce identical results. Differences can reveal tracking gaps, missing variables, model assumptions, or channels that capture existing demand.
What Happens When MTA and MMM Disagree?
Disagreement should trigger investigation.
Review:
- Attribution windows
- Channel definitions
- Conversion definitions
- View-through credit
- Missing offline outcomes
- Identity-resolution rates
- Model controls
- Promotional periods
- Spend variation
- Baseline demand
- Geographic differences
- Credible intervals
A channel may perform well in MTA because it appears near the end of many customer journeys. MMM may assign it a lower incremental contribution after controlling for brand demand. An experiment can help determine which interpretation better supports the budget decision.
How Incrementality Testing Supports MTA and MMM
Incrementality testing asks what would have happened without the marketing activity.
Common methods include:
- Geographic holdouts
- Audience holdouts
- Conversion-lift tests
- Budget-increase tests
- Budget-reduction tests
- Market-level heavy-up tests
Experiments can evaluate channels that MTA may overcredit or undercredit. They can also provide priors or calibration evidence for MMM.
Google recommends using geo experiments to anchor marketing strategy and calibrate MMM results.[⁵]
Build a Stronger Measurement System With National Positions
National Positions helps businesses connect MTA, MMM, first-party data, and incrementality testing into an actionable measurement system.
AdBeacon, the agency’s proprietary multi-touch attribution platform, supports first-party click-to-conversion journey tracking and campaign-level performance analysis. National Positions also integrates AdBeacon with Google’s Meridian MMM to evaluate channel contribution, response curves, diminishing returns, and budget scenarios.[⁶]
The agency’s measurement services can include:
- MTA tracking-readiness reviews
- MMM data-feasibility assessments
- Channel and KPI inventories
- Historical-data quality reviews
- Attribution-window comparisons
- First-party data analysis
- Media mix modeling
- Geographic and audience holdout tests
- Budget-allocation scenarios
- Measurement implementation roadmaps
If your platforms claim credit for the same conversions or your team cannot confidently explain where the next marketing dollar should go, request a measurement assessment from National Positions.
Frequently Asked Questions
What is the main difference between MTA and MMM?
MTA assigns conversion credit across recorded customer touchpoints. MMM estimates how changes in channel activity contribute to changes in an aggregate business outcome.
Is MTA or MMM better for campaign optimization?
MTA is generally better for campaign-, advertisement-, keyword-, and touchpoint-level optimization. MMM is generally better for broader channel allocation and long-term planning.
Can MTA measure offline marketing?
MTA can include offline events that connect to known customers or accounts, including tracked calls, event registrations, CRM activity, coupon codes, and point-of-sale purchases. It has limited visibility into anonymous offline exposure.
Can MMM measure digital and offline channels?
MMM can include digital and offline channels when reliable spending, exposure, geographic, and outcome data are available.
Does MMM prove causation?
A well-designed MMM can support causal estimates, but those estimates depend on model structure, controls, data quality, and assumptions. Incrementality experiments provide valuable calibration or validation.
What is marginal ROI?
Marginal ROI estimates the expected return from the next dollar invested in a channel. It can be more useful for budget allocation than historical average ROI.
What is adstock?
Adstock represents the delayed and continuing effect of advertising after the initial exposure.
What is channel saturation?
Channel saturation occurs when additional investment produces progressively smaller gains. Response curves help estimate where diminishing returns begin.
How much historical data does MMM need?
There is no fixed requirement. Many national time-series models use two or more years of weekly data, but geo-level variation, channel complexity, spending changes, and model design also affect feasibility.
Can a newer business use MMM?
Possibly. A newer business may have enough data if it has frequent observations, geographic variation, and meaningful changes in channel spending. A feasibility assessment should determine if the available data can support reliable modeling.
How often should an MMM be refreshed?
Refresh frequency depends on data availability, spending changes, seasonality, and business needs. Quarterly or semiannual updates may work for some businesses, while rapidly changing organizations may require more frequent monitoring.
Should a business use MTA and MMM together?
A business should consider both when it needs detailed campaign optimization and strategic cross-channel planning. Incrementality testing can help reconcile and validate the results.
Sources
- Google Meridian: Introduction and core benefits
- Google Meridian: Paid-search modeling and query-volume confounding
- Google Meridian: MMM as a causal-inference methodology
- Google Meridian: Assessing model fit and causal results
- Google Meridian GeoX: Incrementality testing and MMM calibration
- National Positions: Media Mix Modeling