Proving ad ROI means connecting advertising costs to measurable business profit using data that can withstand scrutiny from leadership and finance. Clicks, impressions, form submissions, and platform-reported conversions can help diagnose performance, but they do not prove that advertising produced a profitable result.
Reliable ad ROI measurement requires accurate revenue data, a complete record of campaign costs, consistent attribution rules, and a way to estimate how much of the result advertising actually caused. It also requires marketers to acknowledge uncertainty. No attribution model can perfectly reconstruct every customer journey.
The goal is not to produce one impressive number. It is to build a repeatable measurement system that helps your business decide where to reduce, maintain, or increase advertising investment.
Key Takeaways
- Ad ROI measures profit relative to total advertising and campaign costs.
- ROAS measures revenue efficiency, while ROI measures profitability.
- Platform-reported conversions can overlap across Google, Meta, LinkedIn, and other channels.
- Contribution margin provides a more accurate break-even ROAS than gross margin alone.
- Lead-generation businesses must connect campaigns to qualified leads, opportunities, closed customers, and collected revenue.
- First-party data, server-side tracking, CRM integration, and consistent campaign naming improve measurement quality.
- Incrementality testing provides stronger evidence of causation than attribution alone.
- Marketing mix modeling, attribution, incrementality testing, and brand lift answer different measurement questions.
- Executive reports should identify assumptions, limitations, and a range of possible returns.
What Does Proving Ad ROI Mean?
Ad measurement records what happened after advertising activity. Proving ad ROI goes further by determining what financial value the advertising generated, what it cost, and how confident the business can be that advertising contributed to the result.
This distinction matters because attribution and causation are not the same.
Attribution assigns credit to marketing touchpoints associated with a conversion. Incrementality estimates how many conversions occurred because of advertising and would not have happened otherwise.
For example, an advertising platform may count a purchase after a customer viewed or clicked an ad. That does not necessarily mean the ad caused the sale. The customer may have already known the brand, received an email, visited through organic search, or planned to purchase without seeing the ad.
Credible ROI analysis should answer four questions:
- What outcome did the campaign produce?
- How much financial value did that outcome create?
- What did the campaign cost in total?
- How much of the outcome was likely caused by advertising?
How Do You Calculate Ad ROI?
The standard revenue-based formula is:
Ad ROI = (Attributed revenue − total campaign cost) ÷ total campaign cost × 100
This calculation shows how much revenue remained after campaign costs relative to the amount invested. However, it can overstate financial performance because revenue is not the same as profit.
A more useful formula incorporates contribution profit:
Profit-based ad ROI = (Attributed contribution profit − total campaign cost) ÷ total campaign cost × 100
Contribution profit is the revenue remaining after the variable costs required to produce and fulfill the sale. Depending on the business, those costs may include:
- Product costs
- Shipping and fulfillment
- Payment-processing fees
- Sales commissions
- Customer-service expenses
- Usage-based service costs
- Returns and refunds
- Promotional discounts
Profit-based ROI gives marketing and finance a clearer view of the money a campaign contributed to the business.
A Complete Ad ROI Example
Assume an e-commerce business spends:
- $20,000 on advertising
- $4,000 on agency management
- $1,500 on analytics and advertising software
- $4,500 on creative production and landing pages
The total campaign cost is $30,000.
The campaign generates $120,000 in attributed revenue. After product costs, fulfillment, payment fees, discounts, and returns, the company has a 50% contribution margin. That produces $60,000 in contribution profit before campaign expenses.
Revenue-Based ROI
($120,000 − $30,000) ÷ $30,000 × 100 = 300%
Profit-Based ROI
($60,000 − $30,000) ÷ $30,000 × 100 = 100%
The revenue-based calculation produces a 300% return, while the profit-based calculation produces a 100% return. Both calculations are mathematically valid, but they answer different questions.
This is why every ROI report should define what “return” represents. It may refer to revenue, gross profit, contribution profit, or net profit.
ROI vs. ROAS vs. Incremental ROAS
ROAS and ROI are related, but they should not be used interchangeably.
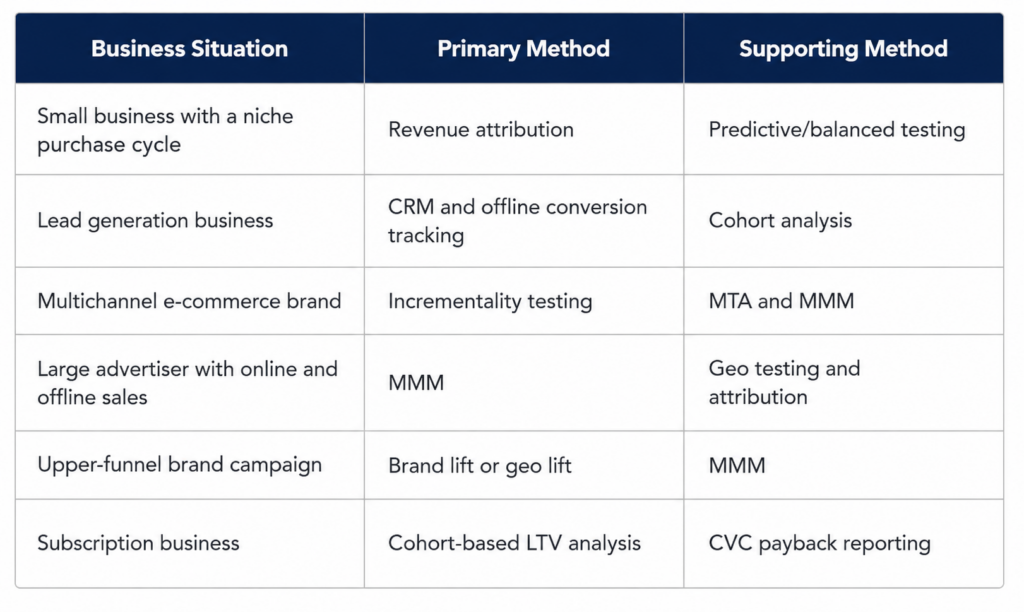
ROAS is useful for comparing campaigns, audiences, and channels. It does not account for agency fees, software, creative production, staff time, or the cost of fulfilling each sale.
Incremental ROAS, or iROAS, attempts to isolate the revenue that occurred because of advertising. It excludes baseline sales that likely would have occurred without the campaign.
ROI provides the broadest financial perspective because it can account for the complete investment and the profit produced.
How Do You Calculate Break-Even ROAS?
A simplified break-even ROAS formula is:
Break-even ROAS = 1 ÷ contribution margin
Contribution margin is generally more useful than gross margin because it can incorporate variable costs beyond the product itself.
Consider a business with the following economics:
- Average order value: $100
- Product and fulfillment costs: $45
- Payment fees and shipping subsidies: $10
- Contribution profit before advertising: $45
- Contribution margin: 45%
The break-even ROAS is:
1 ÷ 0.45 = 2.22x
The business needs approximately $2.22 in revenue for every advertising dollar to cover its variable costs and advertising spend. A reported 2x ROAS would still produce a loss under these assumptions.
Break-even ROAS should be recalculated when prices, product mix, fulfillment costs, discounts, or return rates change.
What Costs Should Be Included in Ad ROI?
An ROI calculation can appear stronger than it is when marketers count media spend but exclude the resources needed to run the campaign.
Depending on the reporting purpose, total campaign cost may include:
- Advertising spend
- Agency or freelancer fees
- Creative strategy and production
- Landing-page development
- Analytics and attribution software
- Call-tracking services
- Marketing automation
- Staff time
- Sales commissions
- Promotional discounts
- Fulfillment expenses
- Payment-processing fees
- Refunds and returns
- Allocated operational overhead
Companies do not always need to include every corporate expense in a campaign-level report. They do need a documented cost policy that finance and marketing apply consistently.
It can help to report two views:
- Media return, which compares attributed revenue with ad spend
- Fully loaded return, which includes the broader costs required to operate the campaign
Why Is Ad ROI Harder to Prove in 2026?
Customer journeys now span multiple devices, browsers, platforms, and offline interactions. Privacy controls, consent requirements, browser restrictions, and closed advertising ecosystems limit the user-level data available to marketers.
Google moved away from its original plan to universally eliminate third-party cookies from Chrome. That change did not restore the older measurement environment. Safari and Firefox restrictions, mobile privacy controls, fragmented journeys, and advertising-platform data boundaries continue to affect attribution.
AI-powered campaign products create another challenge. Automated systems such as Performance Max and Advantage+ can optimize bidding, placement, creative, and audience selection inside the platform. This automation can improve performance, but it can also make it harder for marketers to identify which individual factors produced the result.
Google Analytics can help businesses evaluate customer behavior across websites and apps, but analytics data still needs to be reconciled with advertising platforms, CRM records, and actual financial results.[¹]
No single dashboard provides a complete, neutral record of advertising performance. Businesses need a measurement process that combines multiple data sources and methods.
An Eight-Step Framework for Proving Ad ROI
1. Define the Business Outcome
Choose an outcome that connects to financial value.
For e-commerce, this may be contribution profit or net revenue. For lead generation, it may be qualified pipeline, closed revenue, or collected revenue. For a subscription company, it may be cohort revenue, customer lifetime value, or CAC payback.
Document the primary outcome before evaluating the campaign. Changing the definition after seeing the results creates reporting bias.
2. Establish the Sales Cycle and Attribution Window
An attribution window is the period during which a conversion can be connected to an advertising interaction.
The appropriate window depends on how long customers take to buy. A routine e-commerce purchase may happen within hours or days. A legal, healthcare, home-service, or B2B purchase may take weeks or months.
Use CRM data to calculate the typical time between:
- First marketing interaction
- Lead creation
- Opportunity creation
- Closed sale
- Collected revenue
An attribution window that is too short can exclude legitimate advertising influence. A window that is too long can give advertising credit for unrelated conversions.
Apply the same documented window across comparable reporting periods.
3. Standardize Campaign Tracking
Consistent tracking begins before the campaign launches.
Create rules for:
- UTM source, medium, and campaign fields
- Lowercase naming
- Campaign and creative IDs
- Phone-call tracking
- Landing-page naming
- CRM source fields
- Time zones
- Currency
- Internal and test-traffic exclusions
Preserve the original source fields when leads enter the CRM. Overwriting the first-touch source each time someone returns makes longer customer journeys difficult to analyze.
4. Connect Marketing Data With Revenue Data
A practical measurement system may connect:
- Google Ads
- Meta Ads
- Microsoft Advertising
- LinkedIn Ads
- GA4 or another analytics platform
- CRM data
- Call-tracking data
- E-commerce or payment systems
- Marketing automation
- Offline sales
- Refund and cancellation data
First-party data and server-side tracking can improve conversion capture by reducing dependence on browser-only measurement. Server-side tracking does not automatically solve attribution, consent, duplicate events, or data-quality problems. It must be configured, tested, and reconciled with business records.
5. Calculate Contribution Margin and Total Cost
Determine the financial value of each conversion before setting performance targets.
This requires input from finance or operations. Marketing should know:
- Average order or contract value
- Contribution margin
- Close rate
- Refund or cancellation rate
- Repeat-purchase behavior
- Customer lifetime value
- Average CAC
- CAC payback period
Use these figures to establish break-even and target returns.
6. Select the Right Measurement Methods
Different methods answer different questions.
Attribution helps teams understand which touchpoints are associated with conversions. MMM estimates how channel spending affects overall results. Incrementality testing estimates what advertising caused. Brand lift measures changes in awareness, consideration, preference, or intent.
The right combination depends on campaign size, channel mix, available data, and the buying cycle.
7. Validate Major Investments With Experiments
Before scaling a high-spend channel, test how much additional value it produces.
Common approaches include:
- Geographic holdout tests
- Audience holdout tests
- Conversion-lift studies
- Matched-market tests
- Controlled budget reductions
- Brand-search lift studies
Tests should account for seasonality, promotions, pricing changes, geographic differences, competitor activity, and contamination between exposed and control groups.
8. Report Results With Assumptions and Actions
An executive-ready report should include:
- Total investment
- Attributed revenue
- Contribution profit
- ROAS
- ROI
- CAC
- Incremental lift, if tested
- Comparison with the target return
- Attribution window
- Reporting period
- Data limitations
- Recommended budget action
Do not end with a dashboard. Explain what the business should do next.
How Do You Prove Ad ROI for Lead Generation?
Lead-generation businesses cannot calculate reliable ROI from form submissions or phone calls alone. They must connect advertising data with CRM and sales outcomes.
A complete funnel may include:
- Ad interaction
- Form submission or phone call
- Marketing-qualified lead
- Sales-qualified lead
- Opportunity
- Closed customer
- Collected revenue
Each stage answers a different question.
- Cost per lead measures initial response efficiency.
- Cost per qualified lead measures lead quality.
- Cost per opportunity measures pipeline creation.
- CAC measures the cost of acquiring a customer.
- Closed-revenue ROI measures realized financial performance.
Useful formulas include:
Cost per qualified lead = Total campaign cost ÷ qualified leads
Customer acquisition cost = Total sales and marketing cost ÷ new customers
Pipeline ROI = (Attributed pipeline value − campaign cost) ÷ campaign cost × 100
Closed-revenue ROI = (Attributed closed revenue − campaign cost) ÷ campaign cost × 100
Pipeline ROI is a forecast. Closed-revenue ROI is based on completed sales. Businesses should not present forecasted pipeline as realized revenue.
Call tracking is particularly important for healthcare practices, legal firms, home-service companies, automotive businesses, and other organizations that generate a significant number of phone leads. Qualified calls and booked appointments should be connected to final sales outcomes whenever possible.
Should Customer Lifetime Value Be Included?
Customer lifetime value can provide a better picture for subscription, membership, and repeat-purchase businesses. It can also create an overly optimistic ROI estimate if projected revenue is presented as though it has already been collected.
Report lifetime value in two separate views:
- Realized return, based on revenue or contribution profit already received
- Forecasted lifetime return, based on expected future customer value
Two useful measurements are:
LTV-to-CAC ratio = Customer lifetime value ÷ customer acquisition cost
CAC payback period = Customer acquisition cost ÷ monthly contribution profit per customer
Segment these calculations by acquisition cohort. Customers acquired during different months, promotions, or campaigns may have different retention and purchasing behavior.
Which Ad Measurement Method Should You Use?
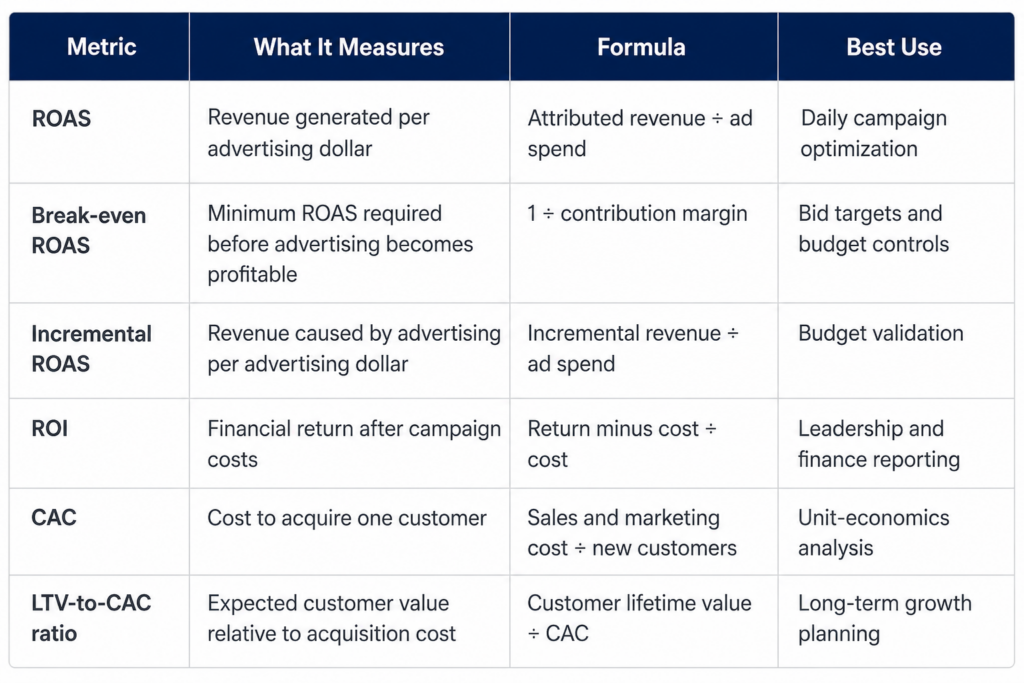
The strongest programs use multiple methods instead of expecting one tool to answer every question. Measured describes this combined approach as triangulated measurement, with experimentation providing causal evidence, MMM supporting portfolio-level decisions, and attribution supporting tactical optimization.[²]
Attribution Methods That Still Matter
Multi-Touch Attribution
Multi-touch attribution distributes conversion credit across several interactions. It can help marketers evaluate complex customer journeys, but it depends on identity resolution and user-level data that may be incomplete.
Use MTA for directional channel and campaign optimization. Do not treat it as definitive proof of causation.
Marketing Mix Modeling
Marketing mix modeling uses aggregated historical data to estimate how advertising and other business factors affect sales or leads. It can incorporate digital, television, audio, retail, direct mail, and offline activity.
MMM is privacy-resilient because it does not require tracking individual customers. It generally requires sufficient historical variation and careful controls for factors such as seasonality, promotions, pricing, and economic conditions.
Incrementality Testing
Incrementality testing compares an exposed group with a control or holdout group. The difference between their outcomes estimates the lift caused by advertising.
This provides stronger causal evidence than platform attribution, but poorly designed tests can still produce misleading results.
Brand Lift
Brand lift studies measure changes in awareness, consideration, preference, recall, or purchase intent. They are useful for upper-funnel campaigns that may not produce immediate clicks or purchases.
Brand advertising can also be evaluated through branded-search lift, direct-traffic trends, geographic testing, and MMM. Direct-response ROAS should not be its only performance standard.
Common Ad ROI Reporting Mistakes
Trusting Every Platform’s Revenue Total
Google, Meta, LinkedIn, affiliates, and other platforms can each claim the same customer. Adding every platform’s attributed revenue together may produce a total greater than the business actually earned.
Reconcile platform reporting with a central source such as the CRM, e-commerce platform, payment system, or financial records.
Reporting ROAS as Profit
ROAS compares attributed revenue with media spending. It does not automatically account for margins, agency fees, creative costs, software, staffing, or fulfillment.
Counting Every Lead Equally
A spam submission, unqualified call, booked consultation, and closed customer do not have the same financial value. Track lead quality and progression through the sales funnel.
Ignoring Baseline Demand
Some customers would have purchased without seeing an ad. Branded search and retargeting campaigns are especially likely to capture existing demand. Incrementality testing can help separate demand creation from demand capture.
Changing Attribution Rules Mid-Period
Changing the attribution model, window, or conversion definition can make historical comparisons unreliable. Document methodology changes and restate prior periods when practical.
Ignoring Conversion Lag
A campaign with a 90-day sales cycle should not be judged solely on revenue closed during its first two weeks. Use cohort reporting to connect customers with the period in which they were acquired.
Treating Estimates as Exact Answers
MMM, attribution, and incrementality testing all involve assumptions. Strong reports disclose confidence ranges, sample limitations, and factors that may have influenced the result.
What Should an Executive Ad ROI Report Include?
A useful report should answer five questions:
- How much did we invest?
- What financial outcome did we produce?
- How confident are we in the result?
- What changed from the previous period?
- What action should we take?
Instead of reporting only “Paid search achieved a 4x ROAS,” provide context:
Paid search generated an estimated $310,000 in contribution profit from $100,000 in total campaign costs. The resulting profit-based ROI was 210%. Brand demand, conversion lag, and overlapping platform attribution may affect the estimate. Based on current performance, we recommend increasing nonbrand search investment by 10% while holding brand spending steady for an incrementality test.
That statement gives leadership a result, methodology, limitation, and decision.
Partner With National Positions
Proving ad ROI is a systems problem, and systems are what we build. National Positions has spent more than 22 years helping over 300 brands turn ad spend into defensible profit. Our 97% client retention rate reflects the long-term relationships we build through performance, transparency, and measurable results.
Everything runs on our PACE methodology, which stands for Plan, Analyze, Convert, and Expand. It is a continuous process built around ongoing measurement and improvement. We plan against your unit economics and break-even ROAS, analyze performance using first-party data and independent attribution, convert traffic through disciplined optimization, and expand investment in channels supported by reliable performance data.
Our marketing technology and AI-powered measurement solutions support this process by connecting campaign activity with meaningful business outcomes. This includes AdBeacon, our first-party attribution platform, which consolidates conversion data through server-side tracking, connects advertising activity with revenue, and provides a clearer view of which channels contribute to sales. As a Google Premier Partner, National Positions also receives access to select measurement tools, insights, and beta opportunities that can support campaign management and client reporting.
Request a Free Advertising ROI Audit
If your advertising platforms, analytics, CRM, and financial reports tell different stories, National Positions can help identify where the disconnect begins.
Our advertising ROI audit can evaluate:
- Tracking and attribution gaps
- Campaign and UTM naming
- CRM conversion reporting
- Platform-to-revenue discrepancies
- Total campaign costs
- Contribution margin and break-even ROAS
- Lead quality and sales-funnel performance
- Attribution windows
- Opportunities for server-side tracking
- Priorities for incrementality testing
You will receive a prioritized measurement roadmap explaining which issues may affect reporting accuracy and what your team should address next.
Book a free consultation with National Positions to build an advertising measurement system that supports clearer budget decisions.
Frequently Asked Questions
What is the difference between ROAS and ROI?
ROAS compares attributed revenue with advertising spend. ROI compares financial return with the total cost of producing that return. A campaign can have strong ROAS but negative ROI when margins and operating costs are too high.
Should ad ROI use revenue or profit?
Profit usually provides the more useful financial measure. Revenue-based ROI can be reported for comparison, but contribution-profit or net-profit calculations give leadership a clearer view of actual financial performance.
How do you calculate ROI for lead-generation ads?
Connect advertising leads with CRM outcomes such as qualified leads, opportunities, closed customers, and collected revenue. Subtract total campaign costs from attributed closed revenue or contribution profit, then divide by total campaign cost.
What expenses belong in an ad ROI calculation?
Expenses may include media spend, agency fees, creative production, software, staff time, landing-page development, sales commissions, fulfillment, payment fees, discounts, refunds, and other campaign-related costs.
What is a good ROAS in 2026?
A good ROAS is one that exceeds the company’s break-even point and supports its profit target. A universal 2x, 3x, or 4x benchmark is not reliable because margins and operating costs vary by business.
What is incremental ROAS?
Incremental ROAS compares the revenue caused by advertising with ad spend. It attempts to exclude sales that would have happened without the advertising exposure.
How can you measure ad ROI without third-party cookies?
Use first-party data, server-side tracking, CRM integration, offline conversion tracking, MMM, cohort analysis, and controlled experiments. These approaches reduce dependence on cross-site user tracking.
How long should an attribution window be?
Base the window on the typical customer buying cycle. Short-purchase e-commerce products may require days, while B2B and high-consideration services may require several months. Apply the window consistently.
Why does CRM revenue differ from GA4 or ad-platform revenue?
The systems may use different attribution models, conversion windows, identities, time zones, and revenue definitions. Ad platforms can also claim overlapping credit for the same customer.
How often should ad ROI be reported?
Campaign teams may monitor directional metrics daily or weekly. Financial ROI should be reviewed monthly or quarterly after allowing for the typical conversion lag. Long-sales-cycle businesses should also use cohort reporting.
Do you need incrementality testing?
Incrementality testing is valuable when the business needs to know if a channel caused additional conversions. It is especially useful for large investments, retargeting, branded search, and campaigns that may capture existing demand.
Sources
- Google, “Google Analytics,” https://marketingplatform.google.com/about/analytics/
- Measured, “Ad Measurement: The Complete 2026 Guide to Accurate, Actionable Marketing Analytics,” https://www.measured.com/faq/ad-measurement-the-complete-2026-guide-to-accurate-actionable-marketing-analytics/
- Cometly, “How to Calculate True Marketing ROI,” https://www.cometly.com/post/calculate-true-marketing-roi
- Windsor.ai, “9 Ways to Effectively Track ROI for Marketing Campaigns in 2026,” https://windsor.ai/ways-to-effectively-track-roi-for-marketing-campaigns/
- Blings, “The 7 Essential Strategies to Track and Measure Marketing Campaign ROI,” https://www.blings.io/blog/best-practices/the-7-essential-strategies-to-track-and-measure-marketing-campaign-roi-2026-guide/