social media plays a pivotal role in connecting businesses with their target audiences. To make effective marketing decisions, relying on data and statistics is essential.
This article explores key social media statistics that can empower businesses to maximize their impact in the ever-evolving landscape.
By leveraging these metrics, you will gain insights into user behavior, platform preferences, and industry trends. These insights enable you to tailor strategies, create compelling content, and deliver personalized experiences.
Whether you’re a small business owner or a marketing professional, the data presented here will help you unlock the potential of social media and drive meaningful results.
Which Social Media is KING?
Understanding how brands are discovered on social media and the reach of different platforms is vital for effective marketing.
We’ll provide insights into average CPC and CMP, enabling businesses to optimize their advertising budgets. Additionally, industry-specific data on conversion rates, CTRs, and CPC on Facebook will help businesses benchmark their performance and identify areas for improvement.
Let’s dive into the realm of social media statistics and unlock the potential for success in this influential landscape.
1. Social Media Usage among US Adults
Social media has become a huge part of our lives, connecting us in ways we never thought possible. If you’re a business trying to reach your target audience, understanding the percentage of US adults using social media is key to maximizing your reach.
Now, let’s look at the numbers for various social media platforms among US adults:
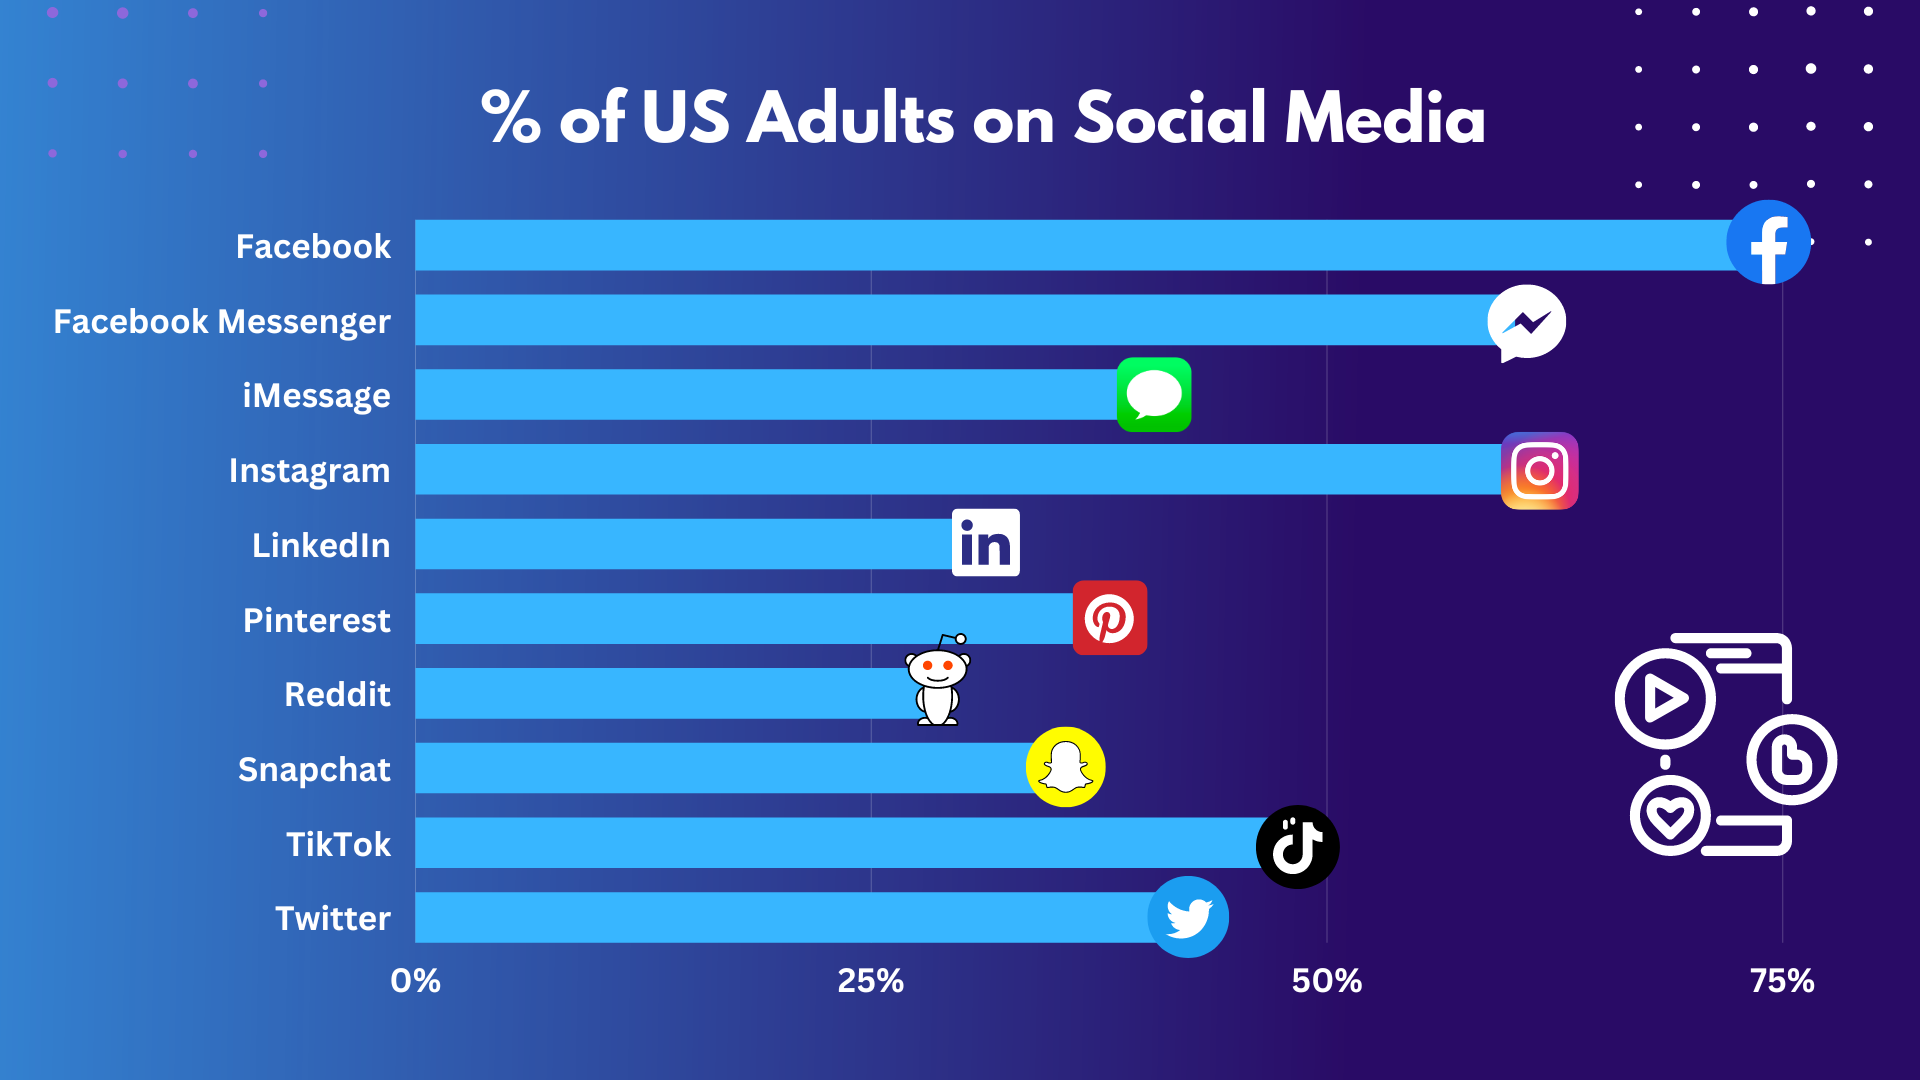
Facebook: It’s no surprise that Facebook takes the lead with around 74% of US adults actively using it. It’s the granddaddy of social media platforms, connecting people of all ages and interests.
Facebook Messenger: Coming in strong, Facebook Messenger boasts a usage rate of about 60% among US adults. It’s a popular choice for quick and convenient communication.
iMessage: Apple users, rejoice! iMessage captures the attention of about 40% of US adults. It’s the default messaging app on Apple devices, keeping us connected in the Apple ecosystem.
Instagram: If you’re looking for a visual feast, Instagram is the place to be. Around 61% of US adults indulge in the world of stunning photos and engaging content.
LinkedIn: When it comes to professional networking, LinkedIn takes the stage. Approximately 30% of US adults use LinkedIn to connect, collaborate, and explore career opportunities.
Pinterest: If inspiration is what you seek, look no further than Pinterest. This creative haven captures the hearts of around 37% of US adults, offering a plethora of ideas and visual discoveries.
Reddit: For those craving interesting discussions and diverse communities, Reddit is the place to be. Roughly 29% of US adults engage in this platform’s vast array of topics and conversations.
Snapchat: Known for its disappearing content and playful filters, Snapchat attracts about 37% of US adults, particularly younger audiences seeking fun and authenticity.
TikTok: The short-form video sensation, TikTok, has taken the world by storm. With a whopping 47% of US adults actively using it, TikTok has become a cultural phenomenon, especially among Generation Z.
Twitter: Last but not least, Twitter keeps us informed and entertained with its real-time updates and engaging discussions. Around 42% of US adults hop on Twitter for their daily fix.
With a majority of US adults actively using social media, businesses have a tremendous opportunity to reach their target audience, engage with them on a personal level, and make a lasting impact.
By understanding the social media landscape and harnessing the power of these platforms, businesses can navigate the ever-evolving digital world and create meaningful connections that drive success.
2. Understanding the Main Reasons for Social Media Usage
Social media platforms have transformed into vibrant digital spaces that cater to a wide range of needs and interests.
Understanding the main reasons people use social media is vital for businesses aiming to engage their target audience effectively.
Let’s explore the primary motivations behind social media usage:
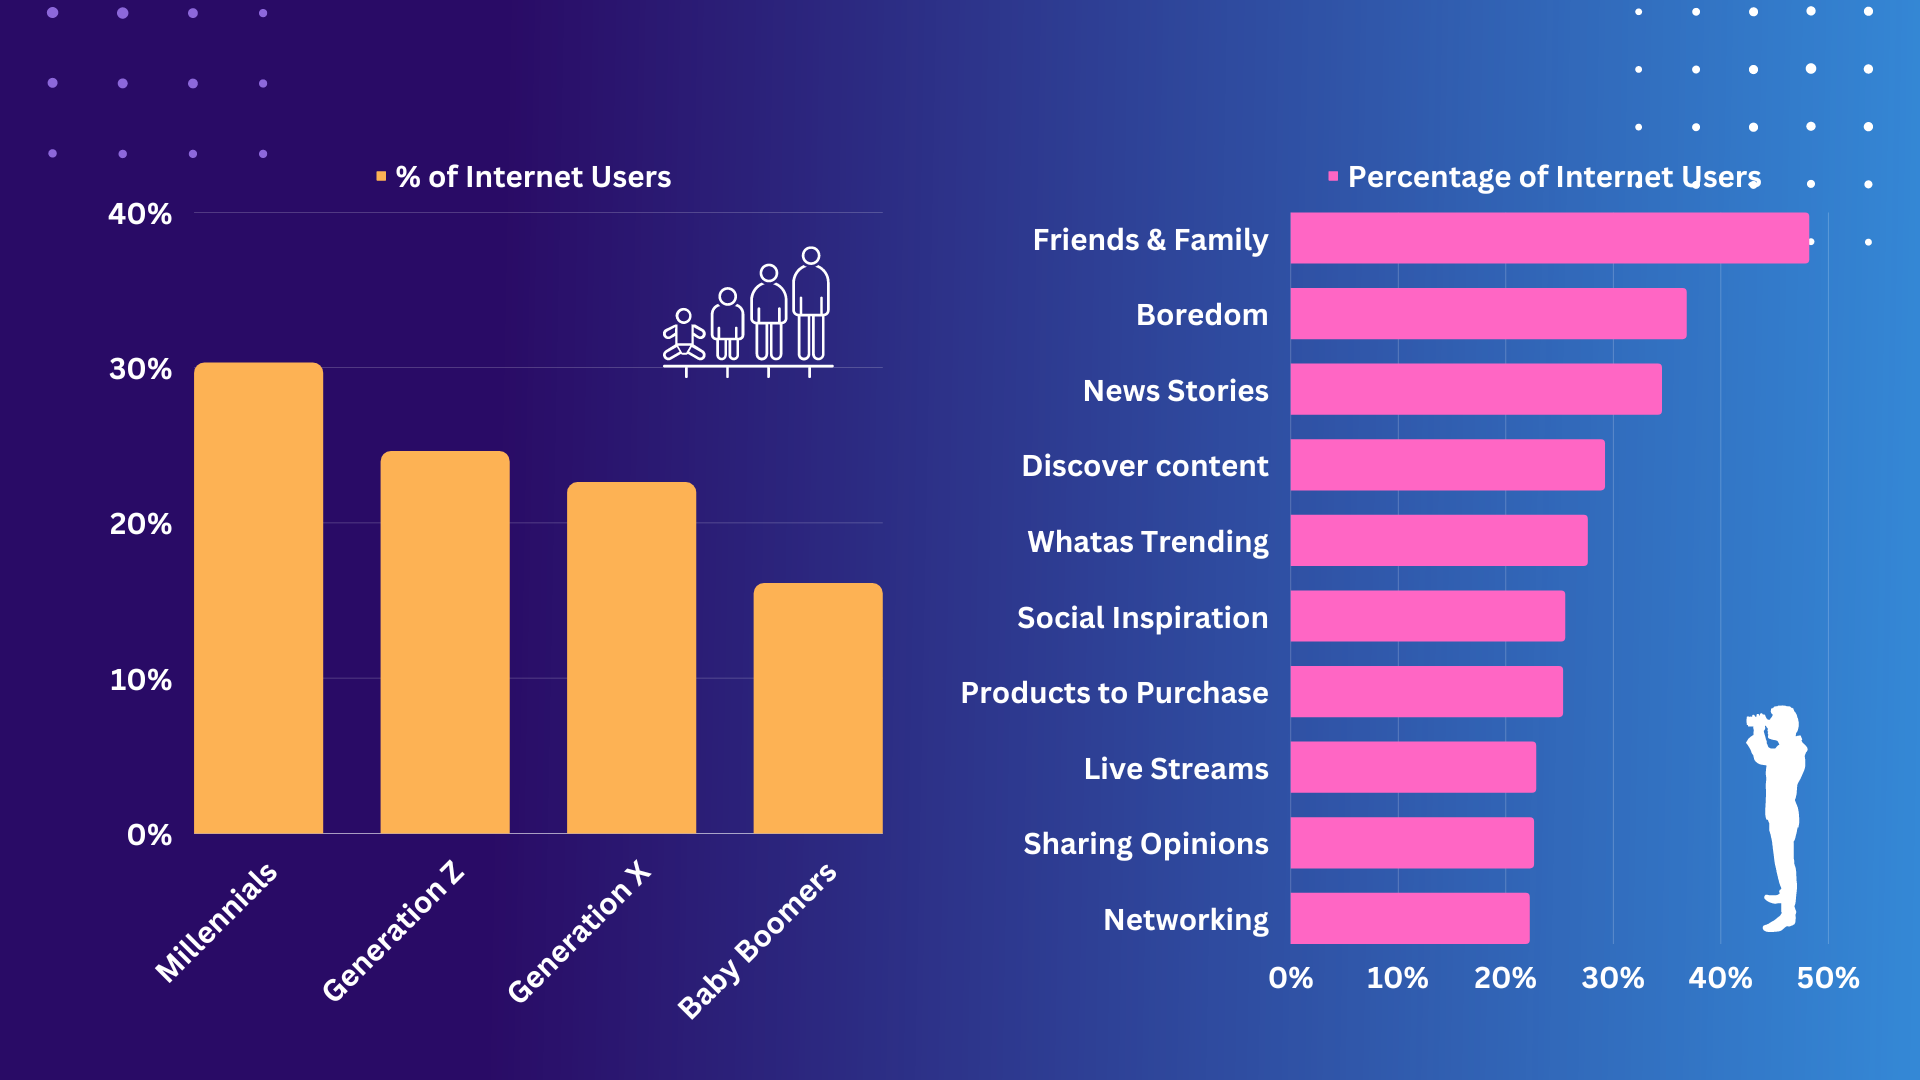
Connecting with friends and family: For nearly half of internet users (48%), social media serves as a digital gathering place to connect, share updates, photos, and experiences with loved ones.
Escaping boredom: Social media offers an entertaining escape for 37% of users, providing a constant stream of engaging content and a way to pass the time.
News consumption: Approximately 35% of users rely on social media platforms for real-time updates and curated content across a wide range of topics.
Content discovery: For 29% of us, social media serves as a platform to discover engaging and tailored content, including videos, articles, and photos.
Staying on top of trends: About 28% use social media to explore trending topics in various fields like fashion, beauty, technology, and entertainment.
Finding inspiration: Social media provides a constant source of inspiration for 26% of users, whether they seek creative ideas, lifestyle inspiration, or motivational content.
Product discovery: Approximately 25% of users leverage social media platforms to discover and make purchasing decisions based on recommendations, sponsored content, and user reviews.
Live streaming: Live streaming has gained popularity among 23% of users, as social media platforms offer real-time access to events, performances, and interactive experiences.
Opinion sharing and online communities: Social media serves as a platform for 23% of users to share their opinions, engage in discussions, and participate in online communities on various topics.
Networking opportunities: About 22% of users turn to social media platforms, particularly LinkedIn, for networking, sharing insights, exploring career opportunities, and building industry relationships.
By delivering relevant and engaging experiences, businesses can foster meaningful connections and drive engagement with their target audience.
3. Time Spent on Various Social Media Platforms
It is not just about using social media – it also comes down to where that social media time is being spent. When we know where the attention is we can hone our efforts accordingly.
Let’s explore the average time users spend per day on various platforms:
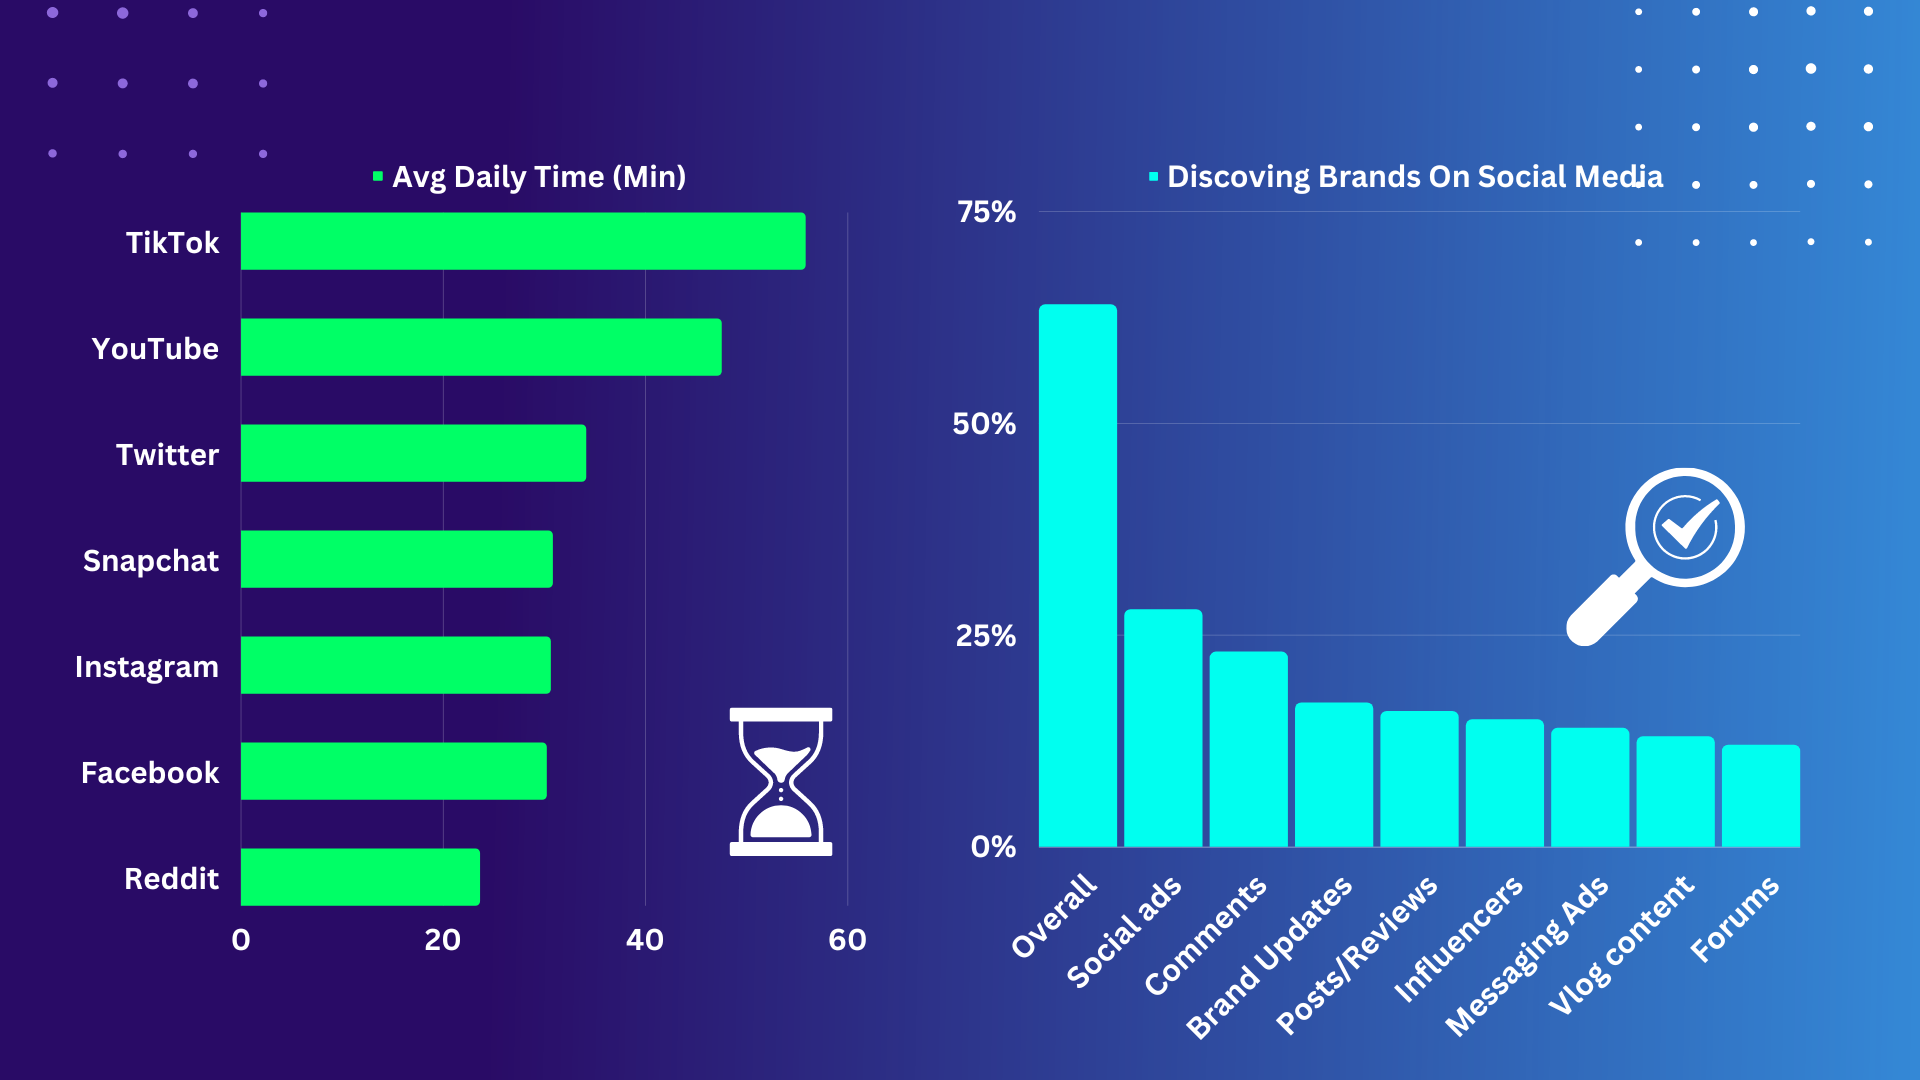
TikTok: Users spend an average of 55.8 minutes per day on TikTok, immersed in its addictive short-form videos.
YouTube: With a vast library of content, users dedicate around 47.5 minutes per day to YouTube’s videos.
Twitter: Users engage with Twitter for approximately 34.1 minutes per day, staying updated with real-time updates and discussions.
Snapchat: Snapchat captures users’ attention for about 30.8 minutes per day with its ephemeral nature and interactive features.
Instagram: Users spend around 30.6 minutes per day on Instagram, scrolling through visually captivating content.
Facebook: Despite its longevity, users still engage with Facebook for an average of 30.2 minutes per day, connecting with diverse content and social interactions.
Reddit: Reddit users spend about 23.6 minutes per day exploring its diverse communities and discussions.
.
4. Social Platforms For Generation Z!
The infamous Generation Z. They spend more time on social media than some combined generations and drive everything from trending content to purchases made by the household at large.
Their attention and influence are unrivaled and knowing where they prefer to spend their social hours should not be overlooked.
Here is how the numbers shake out!
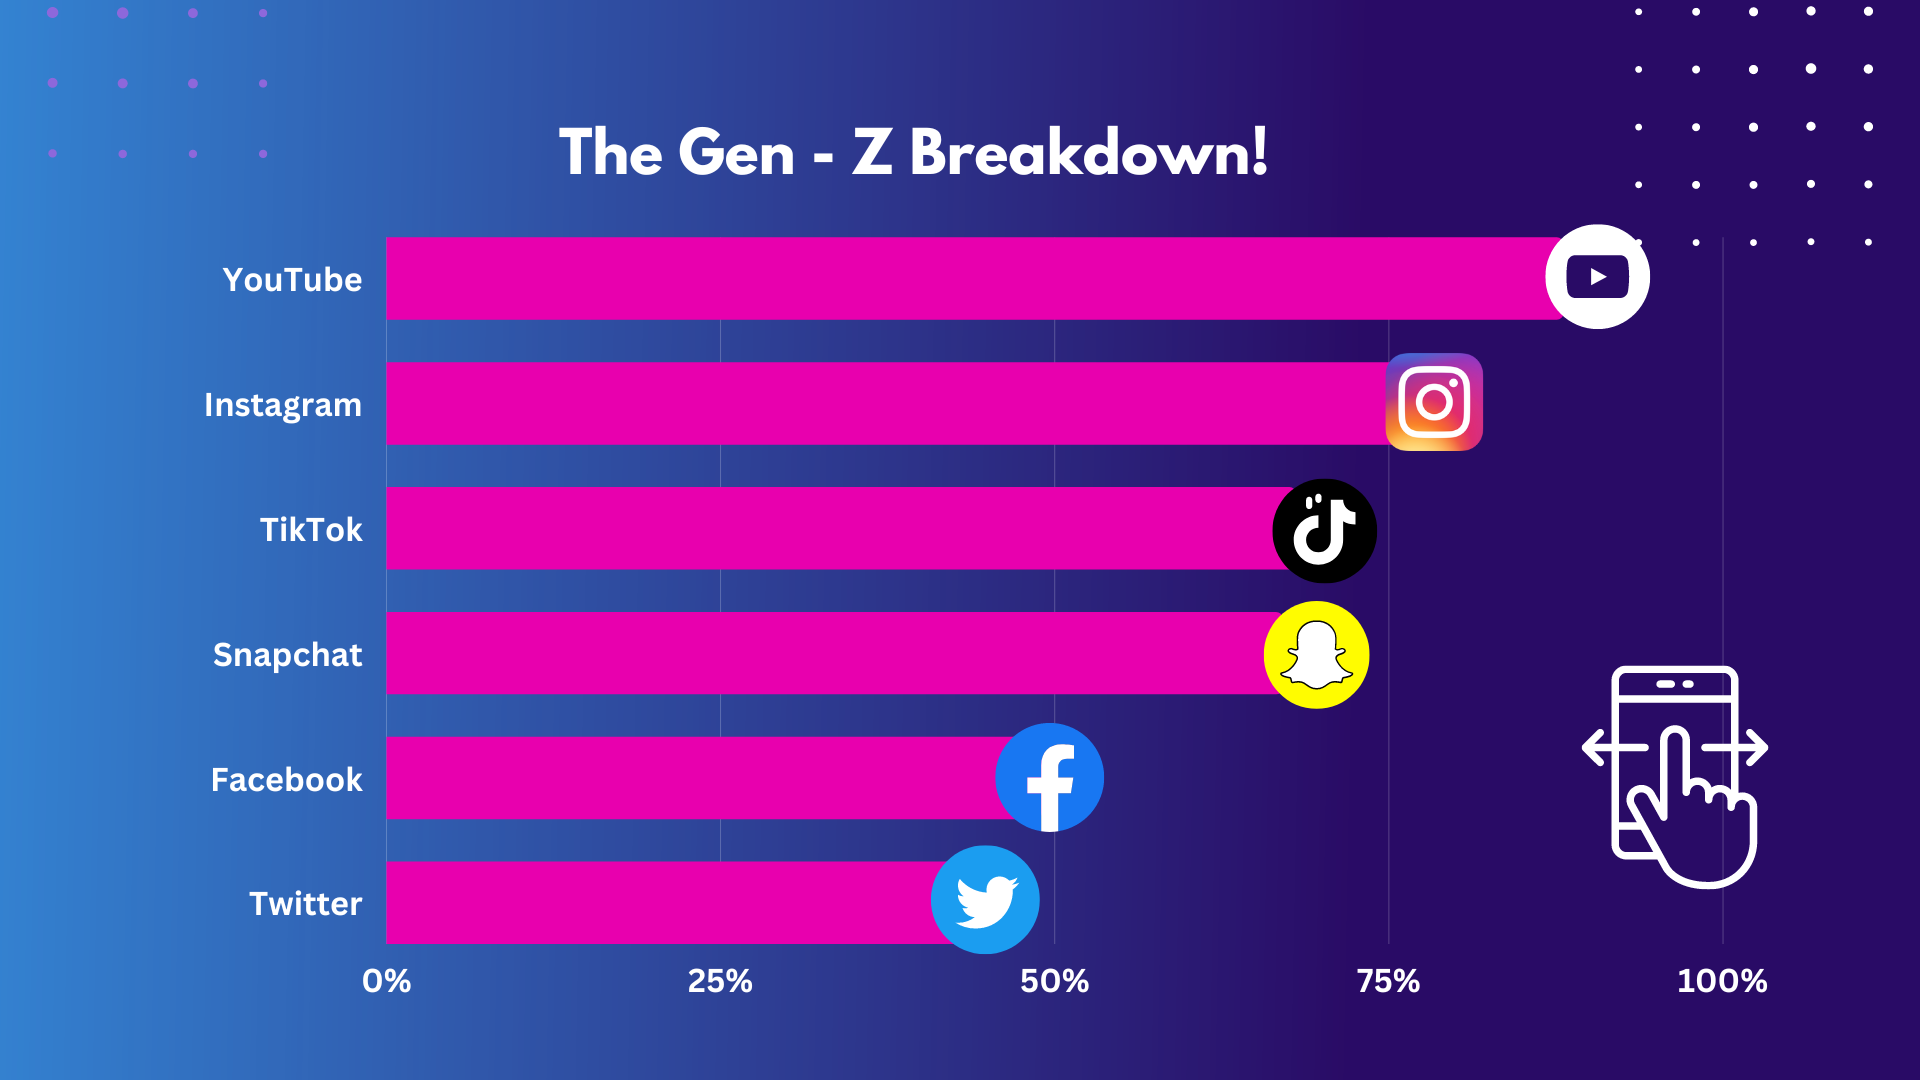
YouTube: With 88% of Gen Zers using YouTube, it remains a dominant platform for video consumption and content discovery.
Instagram: Approximately 76% of Gen Zers are active on Instagram, drawn to its visually appealing content and features like Stories and Reels.
TikTok: TikTok has captured the attention of 68% of Gen Zers, becoming a cultural phenomenon with its short-form videos and viral trends.
Snapchat: Around 67% of Gen Zers embrace Snapchat’s ephemeral nature and interactive features, making it a popular platform for casual sharing and communication.
Facebook: While Facebook has seen a decline in popularity among Gen Z, it still retains 49% of the demographic, particularly for connecting with family and older friends.
Twitter: Twitter attracts 47% of Gen Zers, offering real-time updates, engaging conversations, and an outlet for expressing opinions.
With Gen Z, it is all about connection. Connection to the brands they buy from and the connections they make that drive purchasing decisions.
Remember this will soon be the core generation to focus on for all advertisers as more enter the workforce and hold even more purchasing power.
5. Reach by Social Platform
Understanding the reach of different social media platforms is essential for businesses to assess the potential audience size and determine where to focus their marketing efforts.
Let’s explore the reach of various social media platforms, based on the following data:
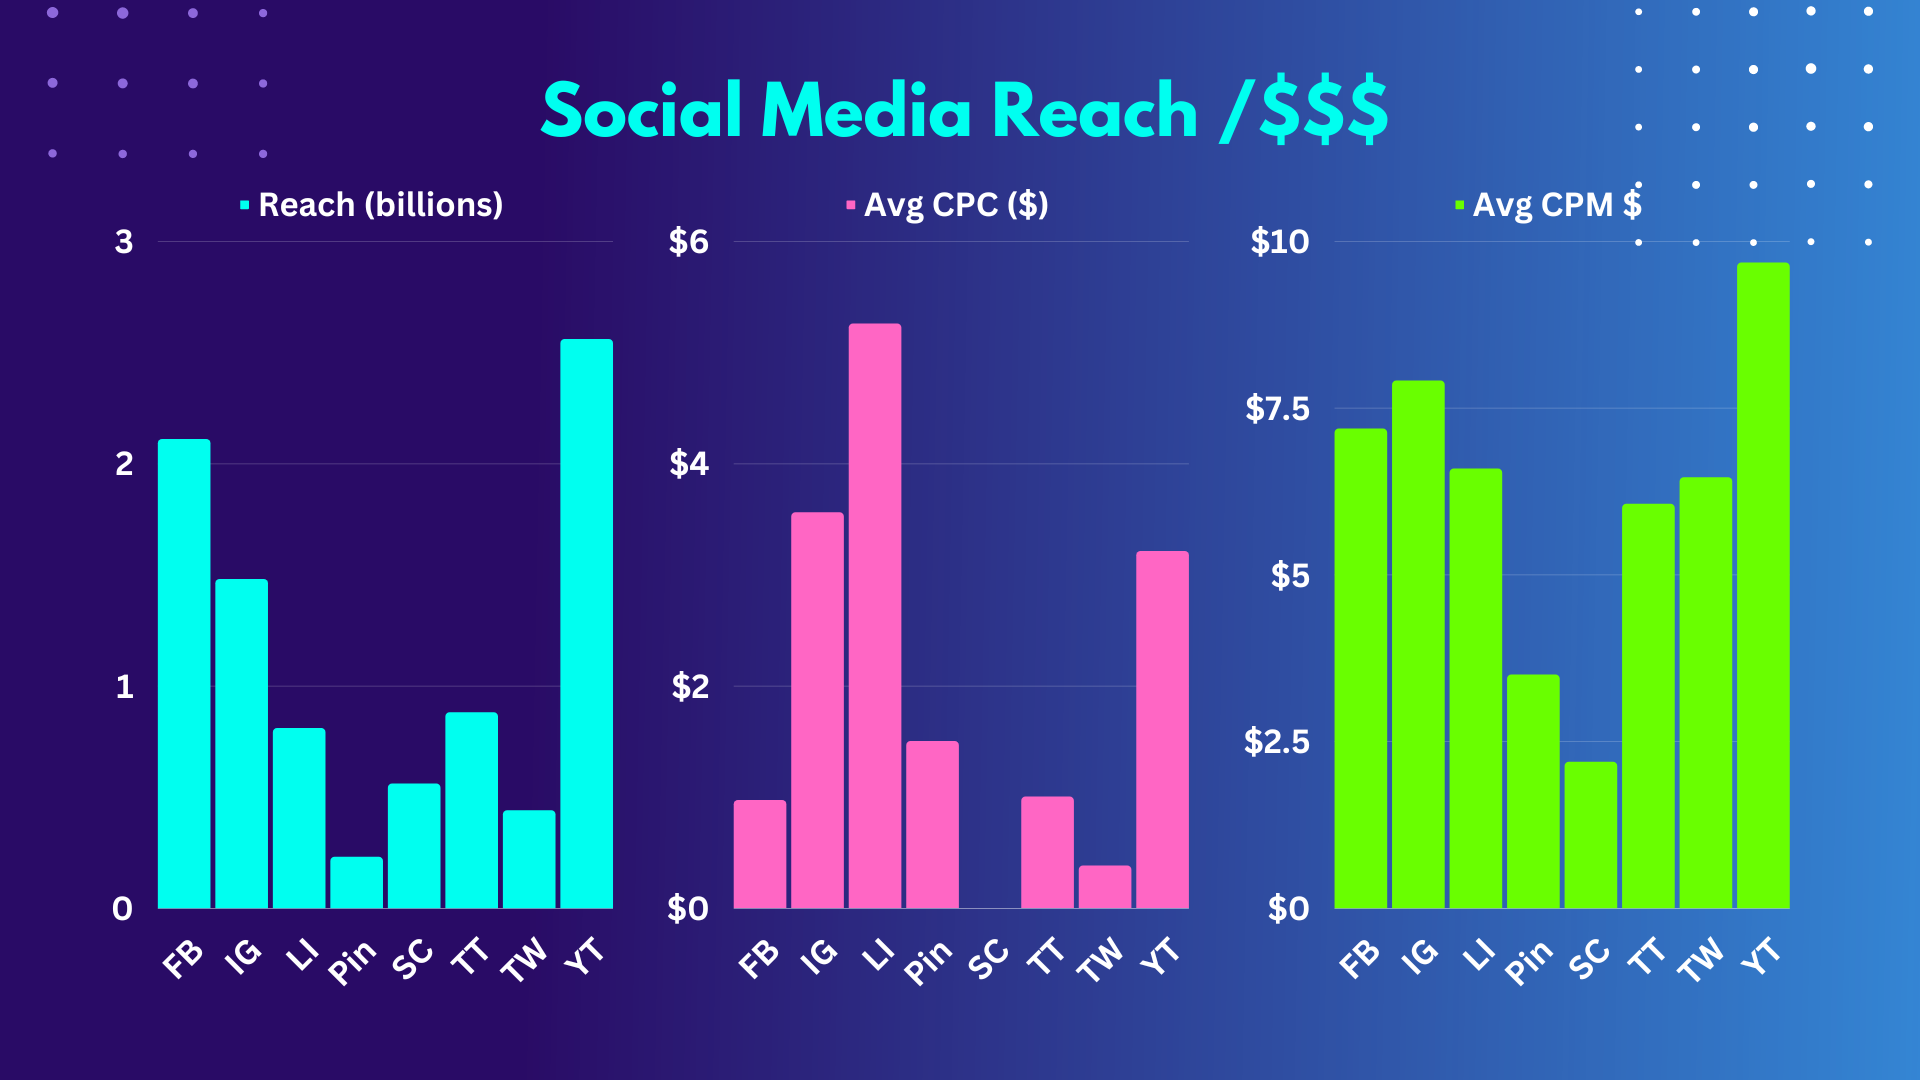
Facebook: With a reach of 2.11 billion users, Facebook remains one of the largest social media platforms, offering businesses access to a vast and diverse audience.
Instagram: Instagram boasts a reach of 1.48 billion users, making it an attractive platform, particularly among younger demographics who appreciate its visual-centric nature.
LinkedIn: With a reach of 810 million users, LinkedIn provides businesses with access to a professional network, making it an ideal platform for B2B marketing and networking.
Pinterest: Pinterest has a reach of 230 million users, appealing to a visually-oriented audience seeking inspiration and discovering new ideas.
Snapchat: With a reach of 560 million users, Snapchat attracts a significant audience, particularly among younger demographics, offering businesses an opportunity to engage with an active user base.
TikTok: TikTok has gained immense popularity, reaching 880 million users globally. Its rapid growth and predominantly younger user base make it an appealing platform for businesses aiming to connect with a dynamic audience.
Twitter: With a reach of 440 million users, Twitter provides a platform for real-time updates, discussions, and engagement, appealing to users interested in timely and interactive content.
YouTube: YouTube boasts a substantial reach of 2.56 billion users, making it the largest video-sharing platform and offering businesses an opportunity to reach a global audience through video content.
6. Average CPC and CPM for Social Media Platforms
Determining the average cost per click (CPC) and cost per thousand impressions (CPM) for different social media platforms is crucial for businesses to optimize their advertising budgets and gauge the effectiveness of their campaigns.
Here are the average CPC and CPM ranges for each platform:
Facebook: The average CPC on Facebook ranges from $0.97 to $2.68, and the average CPM ranges from $5.12 to $8.38.
Instagram: The average CPC on Instagram falls within the range of $0.70 to $2.00, while the average CPM typically ranges from $5.91 to $8.93.
LinkedIn: The average CPC on LinkedIn can range from $5.61 to $9.49, and the average CPM ranges from $6.59 to $8.47.
Pinterest: The average CPC on Pinterest ranges from $0.10 to $1.50, while the average CPM typically ranges from $20 to $30.
Snapchat: The average CPC on Snapchat can range from $1.00 to $3.00, and the average CPM falls within the range of $4 to $8.
TikTok: The average CPC on TikTok can range from $0.10 to $0.30, and the average CPM typically ranges from $10 to $20.
Twitter: The average CPC on Twitter ranges from $0.50 to $2.00, and the average CPM ranges from $6.46 to $9.33.
YouTube: The average CPC on YouTube can range from $0.10 to $0.30, and the average CPM typically falls within the range of $2 to $10.
It’s important to note that the actual CPC and CPM rates may vary based on factors such as ad targeting, industry, ad quality, and bidding strategies. Therefore, businesses should closely monitor their campaigns and adjust their strategies to maximize their return on investment.
7. Conversion Rates by Industry on Facebook
It all comes down to conversion, doesn’t it?!
Analyzing the conversion rates by industry on Facebook provides valuable insights into how different sectors perform in terms of converting social media traffic into desired actions.
Keep in mind that accurate conversions via Social Media can be tricky due to the number of cross-channel clicking that naturally occurs.
If you are having trouble tracking these numbers accurately we highly recommend trying AdBeacon.
AdBeacon is the platform we use for 98% of our paid media campaigns and 100% of our Social media campaigns.
Here are some key findings based on industry average conversion rates:
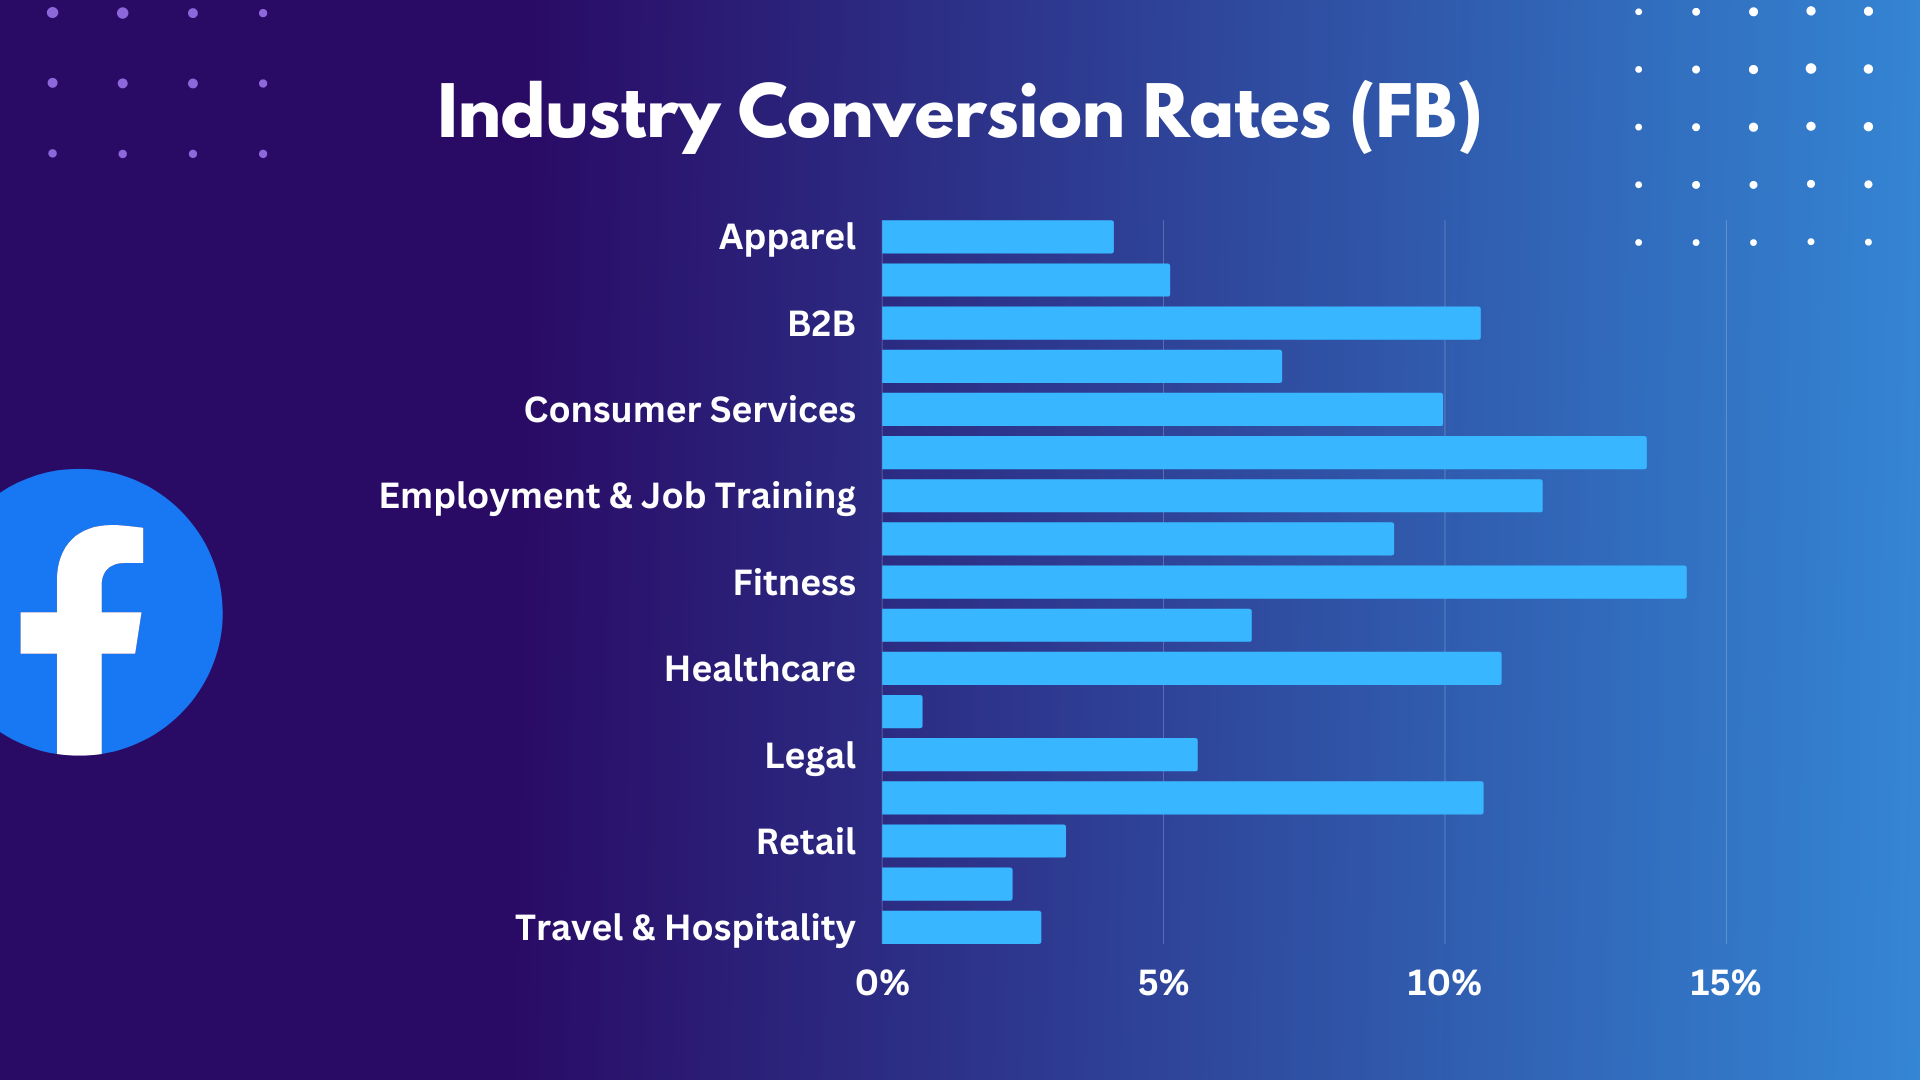
Apparel: The apparel industry demonstrates an average conversion rate of 4.11% on Facebook.
Auto: The auto industry boasts an average conversion rate of 5.11% on Facebook.
B2B: The business-to-business (B2B) sector shows a high average conversion rate of 10.63% on Facebook.
Beauty: The beauty industry exhibits an average conversion rate of 7.10% on Facebook.
Consumer Services: The consumer services sector demonstrates an impressive average conversion rate of 9.96% on Facebook.
Education: The education industry stands out with an impressive average conversion rate of 13.58% on Facebook.
Employment & Job Training: The employment and job training sector showcases a high average conversion rate of 11.73% on Facebook.
Finance & Insurance: The finance and insurance industry maintains a solid average conversion rate of 9.09% on Facebook.
Fitness: The fitness industry demonstrates an outstanding average conversion rate of 14.29% on Facebook.
Home Improvement: The home improvement industry exhibits an average conversion rate of 6.56% on Facebook.
Healthcare: The healthcare industry shows a strong average conversion rate of 11.00% on Facebook.
Industrial Services: The industrial services sector demonstrates a lower average conversion rate of 0.71% on Facebook.
Legal: The legal industry exhibits an average conversion rate of 5.60% on Facebook.
Real Estate: The real estate industry showcases a solid average conversion rate of 10.68% on Facebook.
Retail: The retail industry demonstrates an average conversion rate of 3.26% on Facebook.
Technology: The technology industry shows a lower average conversion rate of 2.31% on Facebook.
Travel & Hospitality: The travel and hospitality industry exhibits an average conversion rate of 2.82% on Facebook.
By analyzing these rates, businesses (like yours) can benchmark their performance, identify areas for improvement, and optimize their marketing strategies on Facebook.
8. Industry Click-Through Rates (CTR) on Facebook
Click-through rate (CTR) is a crucial metric that measures the percentage of users who click on an ad or post after viewing it.
Analyzing industry-specific CTRs on Facebook helps businesses gauge the effectiveness of their campaigns and understand user engagement levels.
Here are the industry click-through rates for different sectors:
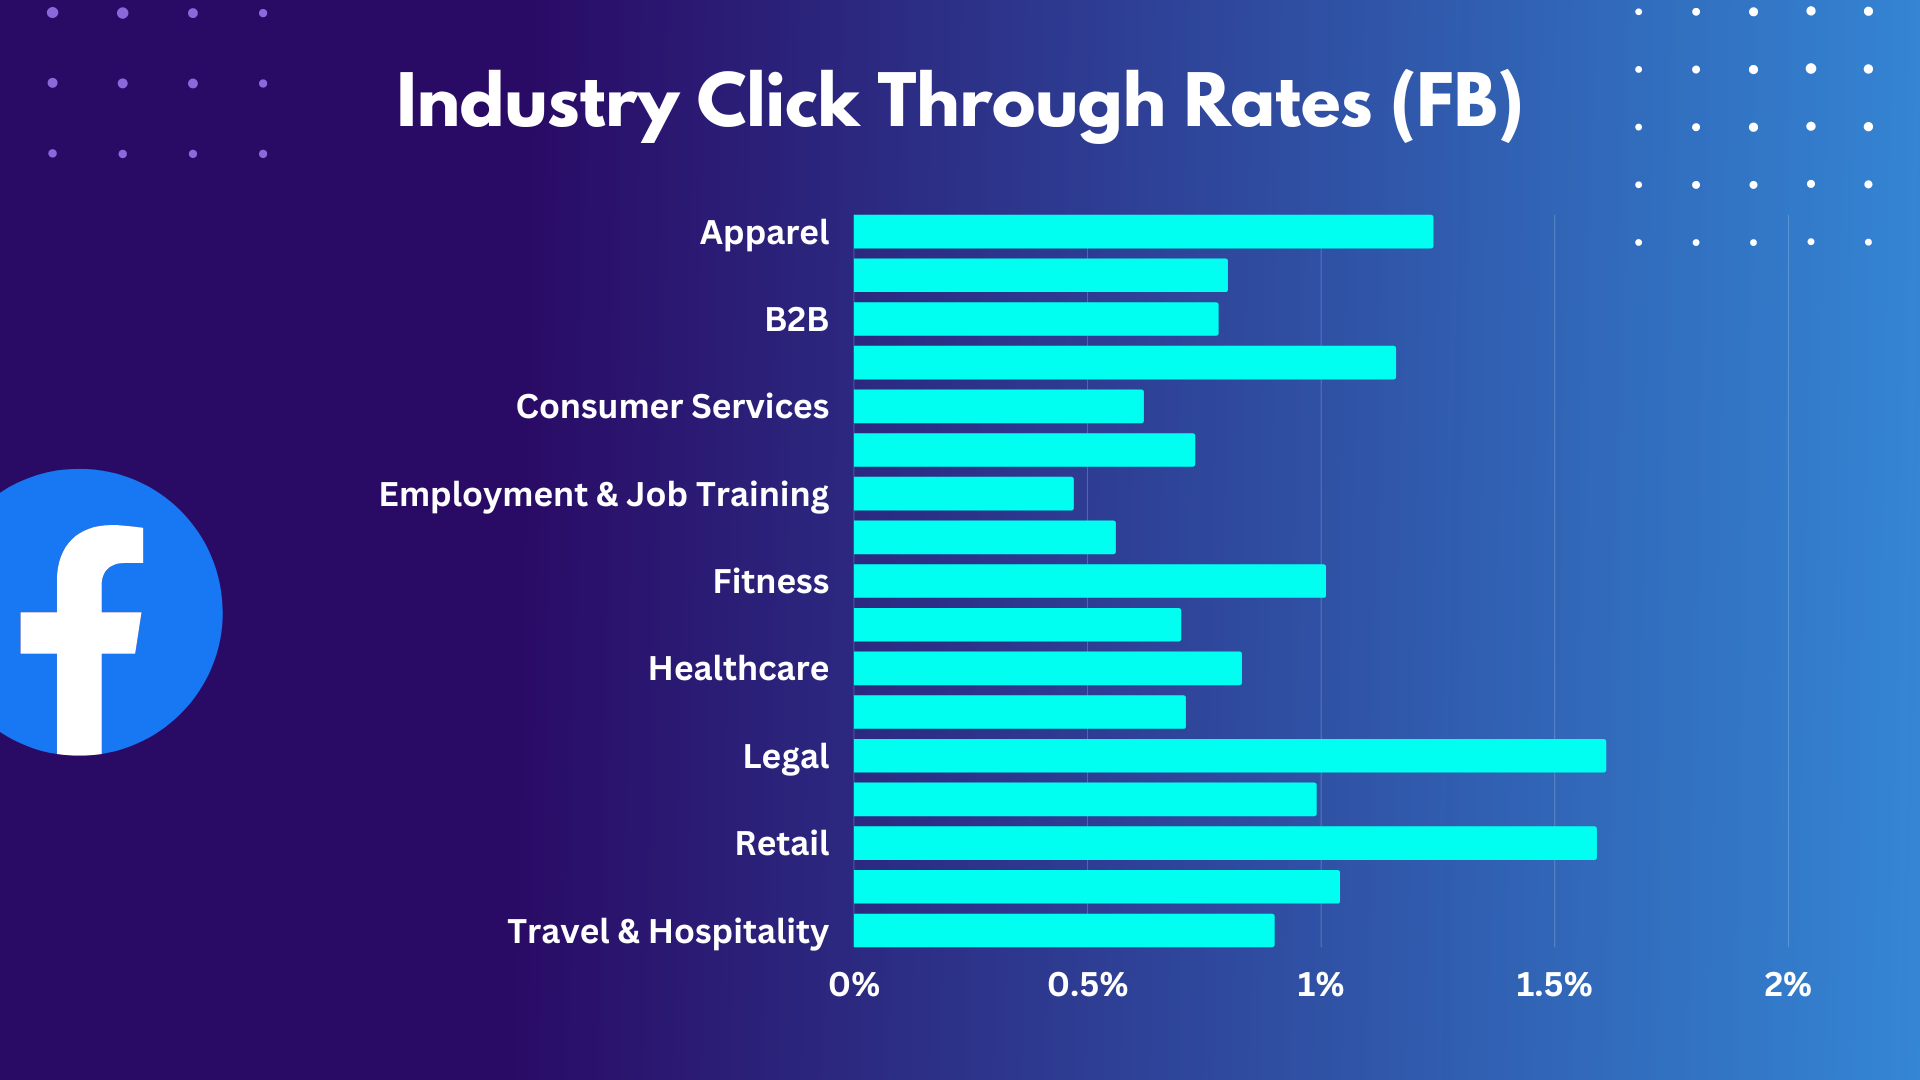
Apparel: The apparel industry experiences an average click-through rate of 1.24% on Facebook.
Auto: The auto industry achieves an average click-through rate of 0.80% on Facebook.
B2B: The business-to-business (B2B) sector records an average click-through rate of 0.78% on Facebook.
Beauty: The beauty industry achieves an average click-through rate of 1.16% on Facebook.
Consumer Services: The consumer services sector witnesses an average click-through rate of 0.62% on Facebook.
Education: The education industry garners an average click-through rate of 0.73% on Facebook.
Employment & Job Training: The employment and job training sector attains an average click-through rate of 0.47% on Facebook.
Finance & Insurance: The finance and insurance industry obtains an average click-through rate of 0.56% on Facebook.
Fitness: The fitness industry generates an average click-through rate of 1.01% on Facebook.
Home Improvement: The home improvement industry achieves an average click-through rate of 0.70% on Facebook.
Healthcare: The healthcare industry records an average click-through rate of 0.83% on Facebook.
Industrial Services: The industrial services sector witnesses an average click-through rate of 0.71% on Facebook.
Legal: The legal industry achieves an average click-through rate of 1.61% on Facebook.
Real Estate: The real estate industry attains an average click-through rate of 0.99% on Facebook.
Retail: The retail industry experiences an average click-through rate of 1.59% on Facebook.
Technology: The technology industry garners an average click-through rate of 1.04% on Facebook.
Travel & Hospitality: The travel and hospitality industry records an average click-through rate of 0.90% on Facebook.
Keep in mind these numbers will shift wildly from year to year based on the supply of advertisers and demand from the market as a whole.
And being that the overall viewership is based on targeting personas and interests these metrics will not be tied as closely to ROI and performance as a platform like Google Ads.
9. Average Cost Per Click (CPC) on Facebook
This is not normally the type of metric we dive into for social media campaigns but it is worth examining nonetheless.
Analyzing the CPC by industry can help organizations understand the advertising costs associated with different sectors.
Here are the average CPCs for various industries on Facebook:
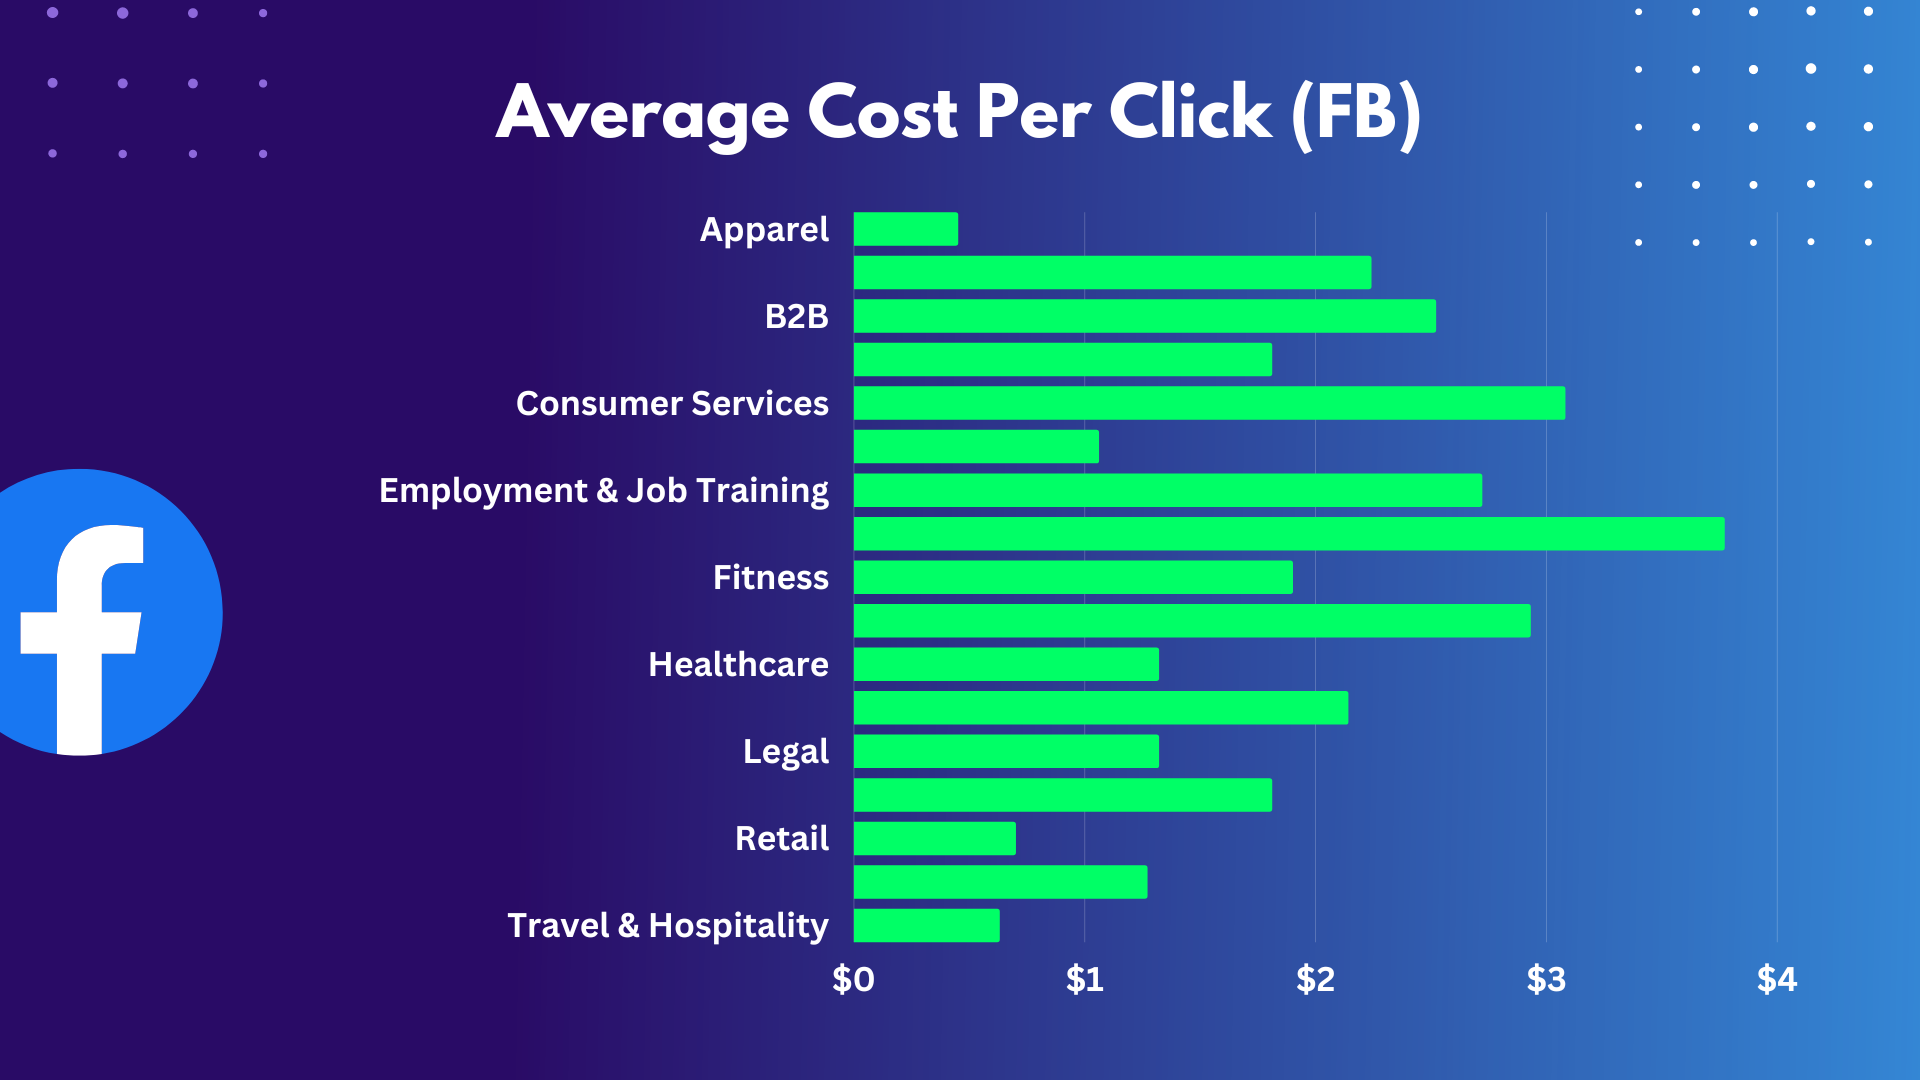
Apparel: The apparel industry has an average CPC of $0.45 on Facebook.
Auto: The auto industry has an average CPC of $2.24 on Facebook.
B2B: The business-to-business (B2B) sector has an average CPC of $2.52 on Facebook.
Beauty: The beauty industry has an average CPC of $1.81 on Facebook.
Consumer Services: The consumer services sector has an average CPC of $3.08 on Facebook.
Education: The education industry has an average CPC of $1.06 on Facebook.
Employment & Job Training: The employment and job training sector has an average CPC of $2.72 on Facebook.
Finance & Insurance: The finance and insurance industry has an average CPC of $3.77 on Facebook.
Fitness: The fitness industry has an average CPC of $1.90 on Facebook.
Home Improvement: The home improvement industry has an average CPC of $2.93 on Facebook.
Healthcare: The healthcare industry has an average CPC of $1.32 on Facebook.
Industrial Services: The industrial services sector has an average CPC of $2.14 on Facebook.
Legal: The legal industry has an average CPC of $1.32 on Facebook.
Real Estate: The real estate industry has an average CPC of $1.81 on Facebook.
Retail: The retail industry has an average CPC of $0.70 on Facebook.
Technology: The technology industry has an average CPC of $1.27 on Facebook.
Travel & Hospitality: The travel and hospitality industry has an average CPC of $0.63 on Facebook.
Knowing social media metrics like this will help you make informed decisions about your marketing strategies, allocate resources effectively, and maximize their impact on social media platforms.
These insights enable businesses to tailor their content, engage with their target audience, and drive meaningful results in the ever-evolving landscape of social media.
Social Media Influence Is On Fire!
To leverage the power of social media effectively, it’s essential to partner with experts who can guide you through the ever-evolving social media landscape.
At National Positions, our team of social media experts is well-versed in the latest strategies and best practices to help businesses thrive in the digital realm.
Whether you need assistance with social media management, targeted advertising campaigns, or content creation, our experts are here to help you achieve your marketing goals.